

The stock market is one of the most complex systems we know about. Millions of intelligent, highly competitive people (and increasingly AIs) try to outwit each other to earn as much money as possible.
In this post we build a simulation where little agents employ different trading strategies on an artificial stock market to replicate key stylized facts of real financial markets, so read on!
You can also watch the video for this post (in German):
This blog post is based on the working paper “A simple agent-based financial market model: direct interactions and comparisons of trading profits” by my colleague Professor Frank Westerhoff from the University of Bamberg. The model was originally partly implemented in NetLogo, a multi-agent programmable modeling environment by Marek Spisak and Roman Sperka as a community model.
It was expanded by the author and later completely transferred into the R programming language with the assistance of ChatGPT-4. The full script can be downloaded here: simple_market_model. Some parts of this post were also written with ChatGPT’s assistance.
There are basically three components of the simulation:
- traders who follow different trading strategies, i.e. technical traders and traders, who employ fundamental analysis,
- communication between the traders, which can be thought of as e.g. informal talks between friends in a pub, coaching programs, and/or social media,
- the stock exchange with a clearing mechanism where supply and demand meet to derive market prices.
We will simulate this market with 500 traders for a time span of about 20 years and record the evolution of prices/returns and the proportion of traders who follow each strategy. After that we are going to analyze the data. All of these parameters can of course be adjusted.
Let us start by explaining each of those components:
At its core there are two basic types of stock analysis: technical analysis and fundamental analysis. Technical analysis in many cases tends to amplify stock price trends because many technical traders buy when stocks are rising and sell when they fall. Fundamental analysis on the contrary often shows mean-reverting behaviour because its adherents try to buy undervalued stocks and sell overvalued ones (this fascinating interplay is examined in more depth here: The Big Picture: Technical + Fundamental Analysis = Buy-and-Hold).
For the sake of simplicity, we assume that traders using fundamental analysis are able to accurately determine the true fundamental value, which we presume to be constant at 1 in our simulation.
Now, traders are not stuck with one strategy but can adapt. In our simulation traders talk to each other and when they see that one strategy performs exceptionally well, they switch with a certain probability.
The interactions of the traders and their (resulting) trading strategies lead to buy and sell orders which need to be cleared on the market. Excess demand will drive prices up while excess supply will drive prices down.
All of this is quite intuitive and seems to reflect some real characteristics of markets, traders, and their interactions… Now, let’s see how this world unfolds: Let the games begin!
The fascinating thing is that this simple market simulation shows many so-called stylized facts of real market dynamics. We will explain those by looking at some resulting plots of the simulation.
Our first plot exhibits the evolution of log prices:
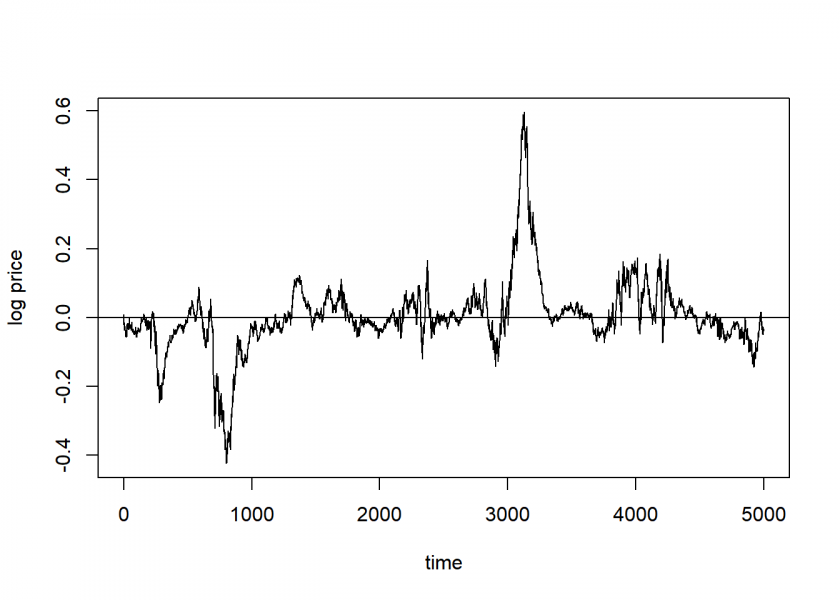
The undulating graph takes us on a journey through a simulated time span of about 20 years, replicating the roller coaster of emotions experienced by traders in real markets. One can observe periods of rapid growth, punctuated by sudden crashes. In the first 4 years (up until around the 1000th day mark), there are two major crashes, followed by a period of relative calm, comparable to a phase from the mid-1980s to 2007 called the Great Moderation.
But as we can see, this calm period is no guarantee of continued stability, as demonstrated by the boom and subsequent bust around the 3000 to 3325 mark. These patterns mirror the bubbles and crashes often seen in real stock markets.
This brings us to a key concept in financial markets, known as the random walk hypothesis. The autocorrelation plot of returns essentially shows no significant (or only spurious) autocorrelation, similar to real-world stock market returns:
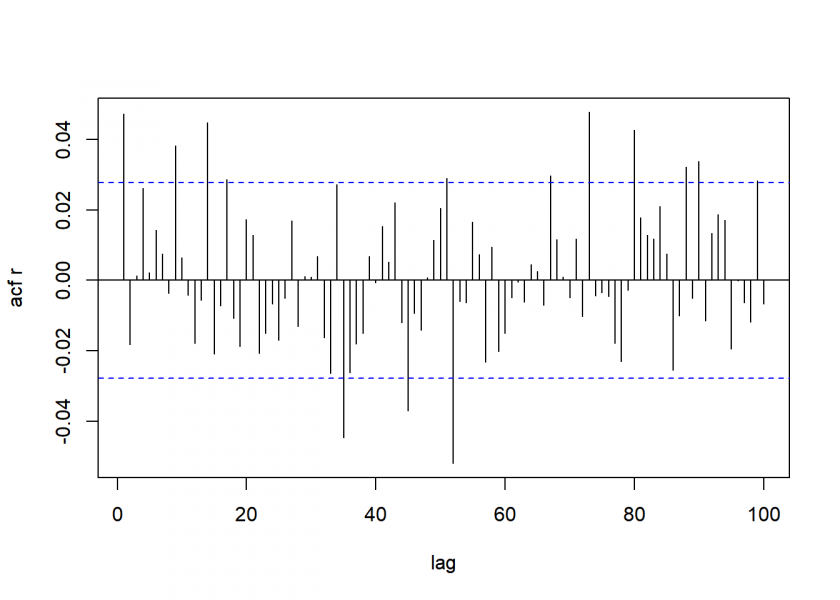
In layman’s terms, this means that the returns from one day to the next are largely unpredictable and show no clear pattern.
Another remarkable aspect shown by our simulation is the so-called fat tails. The distribution of returns reveals that there is more probability mass in the center and in the tails of the distribution, and less in the shoulder parts compared with the normal distribution (in red):
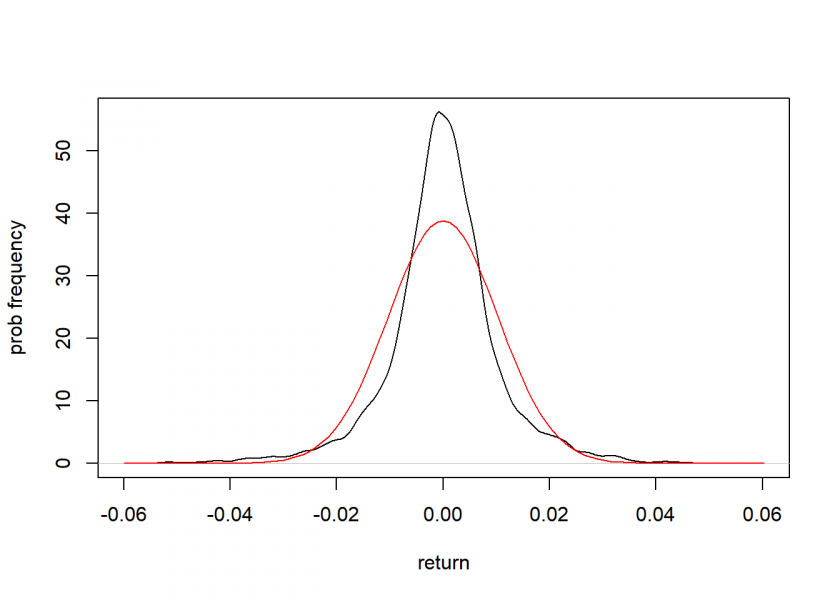
This behaviour is indicative of more frequent extreme price changes (either gains or losses), a characteristic often observed in actual financial markets. On the other hand, there are also many more days than expected when not very much happens.
Let’s have a look at the evolution of returns:
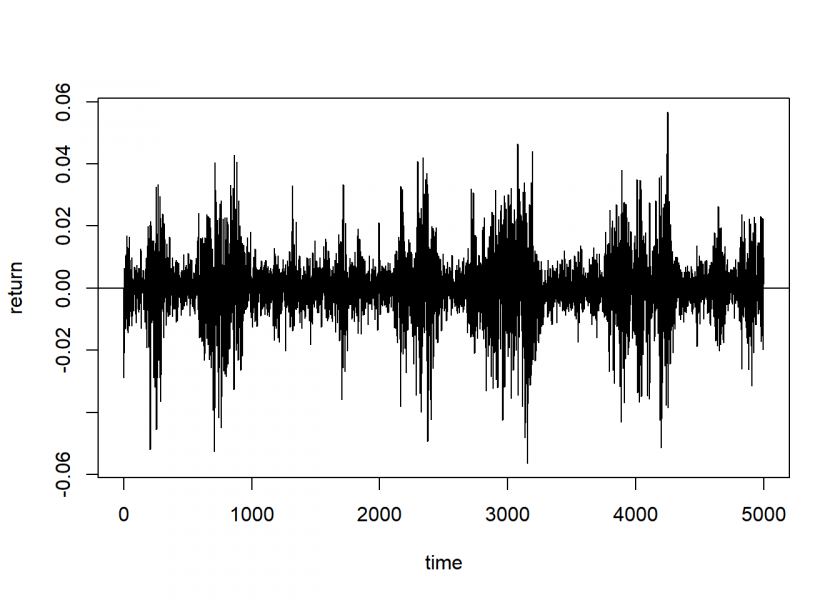
First, all the fluctuations we observe in the simulation are, by definition, excess volatility. We call it “excess” because we have assumed a constant fundamental value of 1 for our assets. Yet, prices fluctuate around this constant value due to the differing trading strategies of our agents. This mirrors real markets, where prices fluctuate due to various factors despite the fundamental value of assets not having changed much.
Another thing can be discerned from this plot, there are periods of relative calm, alternating with periods of large price swings. This phenomenon is called volatility clustering. In our simulation, the autocorrelation of absolute returns shows significant autocorrelation even up to the 100th day:
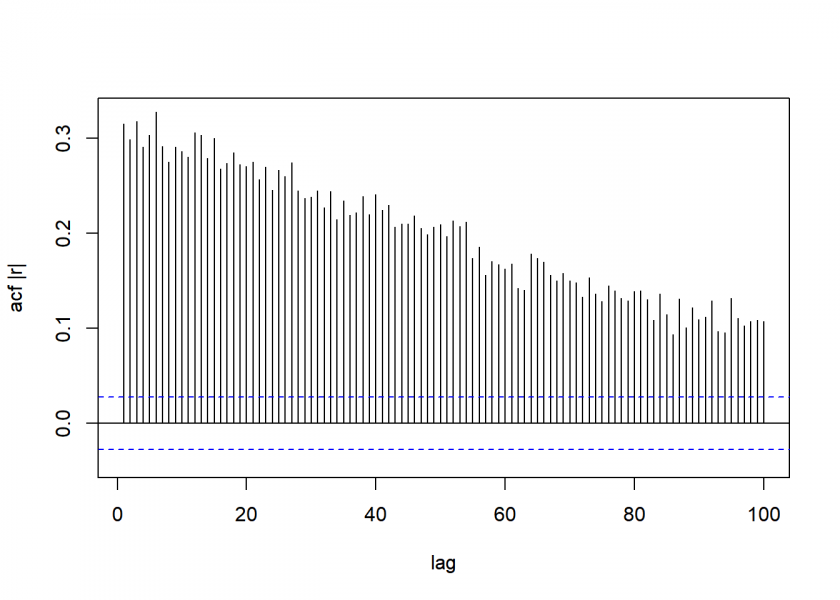
This means that periods of high volatility (large price changes) tend to be followed by periods of similarly large price changes (high volatility), no matter their direction, and calm periods by more calm, forming thereby different volatility regimes, again a fascinating pattern observable in real markets (and one that could potentially be exploited, see Building and Backtesting a Volatility-based Trading Strategy with ChatGPT).
In summary, it’s fascinating that our simple multi-agent model can capture several key stylized facts of real market dynamics: the random walk, bubbles and crashes, fat tails, excess volatility, and volatility clustering. Despite our assumptions’ simplicity, our model demonstrates the complex behaviors seen in the real world, highlighting the power of agent-based models in understanding and potentially predicting market behavior. It’s a testament to the old saying that “more is different”: simple rules at the micro-level can lead to complex, emergent phenomena at the macro-level.
We look forward to doing cool stuff with our little model, e.g. backtesting different trading strategies in future posts. Please also share your experiments with the model in the comments below and stay tuned!
DISCLAIMER
This post is written on an “as is” basis for educational purposes only and comes without any warranty. The findings and interpretations are exclusively those of the author and are not endorsed by or affiliated with any third party.
In particular, this post provides no investment advice! No responsibility is taken whatsoever if you lose money.
(If you make any money though I would be happy if you would buy me a coffee… that is not too much to ask, is it? 😉 )
One thought on “Can a Simple Multi-Agent Model Replicate Complex Stock Market Behaviour?”