

What is the “opposite” of sampling without replacement? In a classical urn model sampling without replacement means that you don’t replace the ball that you have drawn. Therefore the probability of drawing that colour becomes smaller. How about the opposite, i.e. that the probability becomes bigger? Then you have a so-called Pólya urn model!
Many real-world processes have this self-reinforcing property, e.g. leading to the distribution of wealth or the number of followers on social media. If you want to learn how to simulate such a process with R and encounter some surprising results, read on!
The basic idea of the Pólya urn model is to return two balls of the same colour to the urn which you have just drawn. Technically this process results asymptotically in a Dirichlet distribution. While sampling with and without replacement already exists in R (the sample() function and its argument replace = TRUE or FALSE) it is a nice little coding exercise to implement this model.
The following function takes as arguments the colours of the balls at the start cols and the number of draws n (technically n-1 draws because the initial filling of the urn is defined as the first step):
# needs R 4.1.0 or higher to run
polya_urn <- function(cols = c("black", "blue", "green", "red", "yellow"), n = 100) {
urn <- cols |> table() |> as.matrix() |> t()
urn <- rbind(urn, matrix(NA, nrow = n-1, ncol = ncol(urn)))
cols_unique <- colnames(urn)
# n-1 draws from Dirichelet distribution
for (i in seq_len(n-1)) {
urn[i+1, ] <- urn[i, ]
col_sample <- sample(cols_unique, size = 1, prob = (urn[i, ] / sum(urn[i, ]))) # sample ball
urn[i+1, col_sample] <- urn[i+1, col_sample] + 1 # add ball with same colour
}
plot(x = NA, xlim = c(1, n), ylim = c(1, ceiling(max(urn[n, ], na.rm = TRUE) / 10)*10), main = "Polya urn model", xlab = "no. of draws", ylab = "no. of balls", type = "n")
sapply(cols_unique, \(x) lines(urn[ , x], col = x, lwd = 2))
invisible(urn)
}
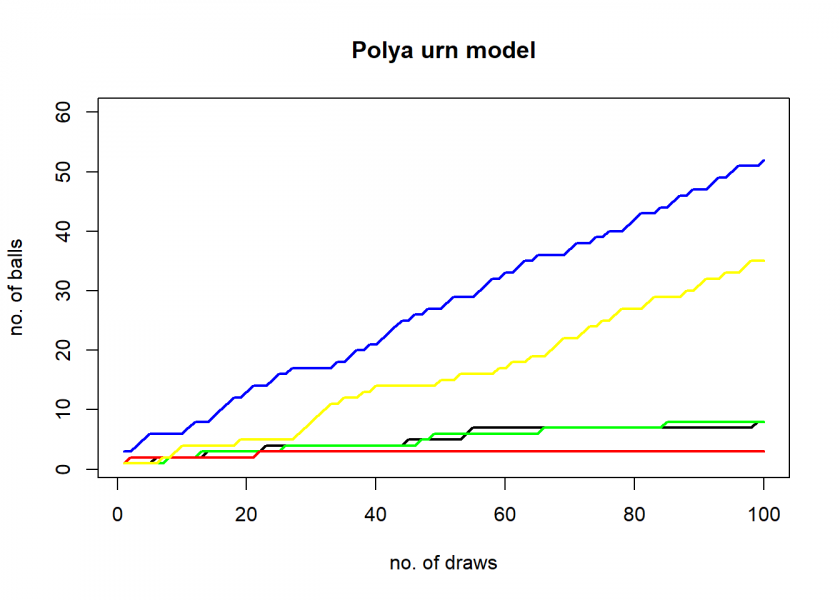
polya_urn()
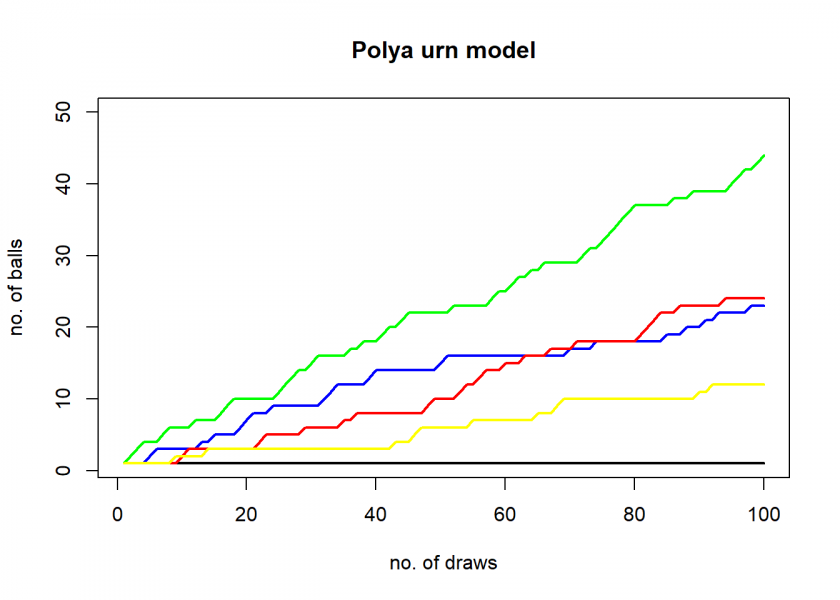
As expected little random differences result in one colour dominating the rest, in this case, green. Please note that results can and will differ because of the involved randomness. To get a feel for the possible, sometimes surprisingly complex, dynamics, let’s run some more simulations:
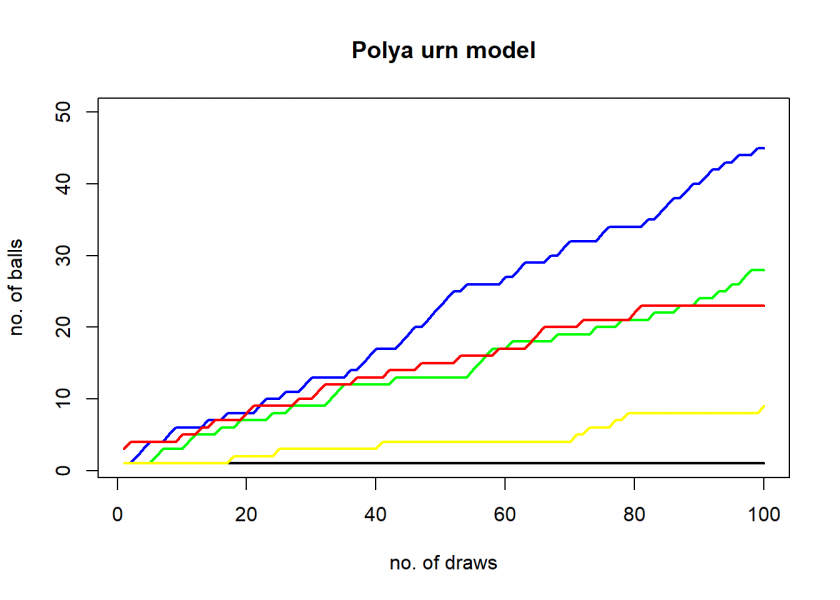
polya_urn()
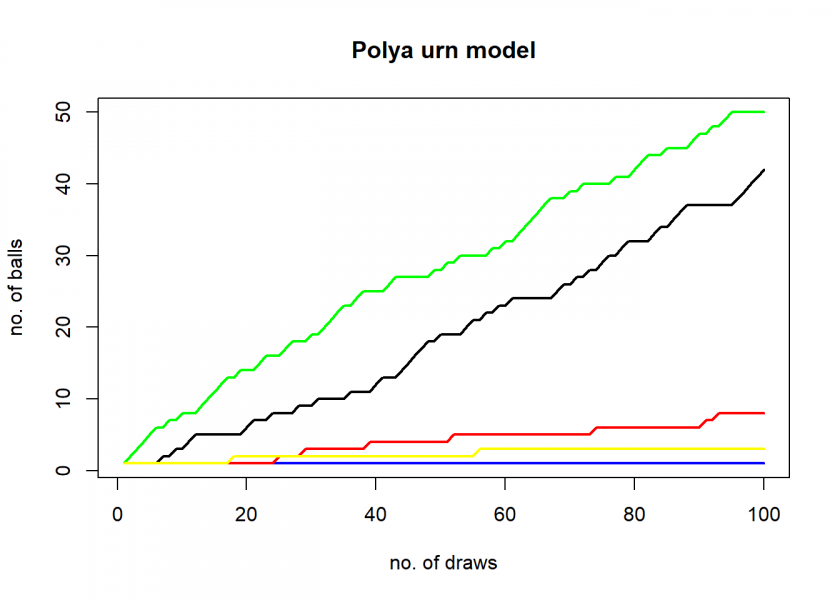
Again, green but this time with a strong contender, black! Now, let us increase the number of draws to 200:
polya_urn(n = 200)
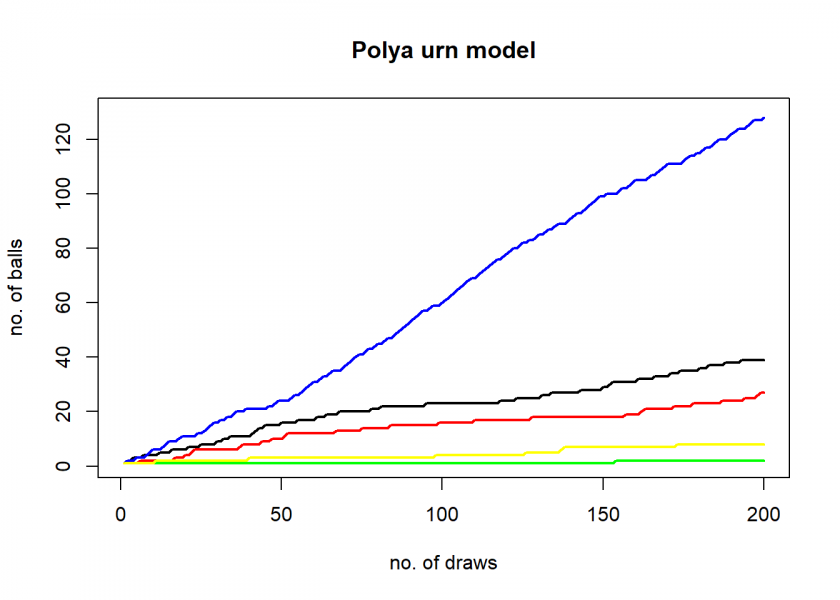
The effect is now much more pronounced, blue leaves all other colours clearly behind. Let’s do this one more time:
polya_urn(n = 200)
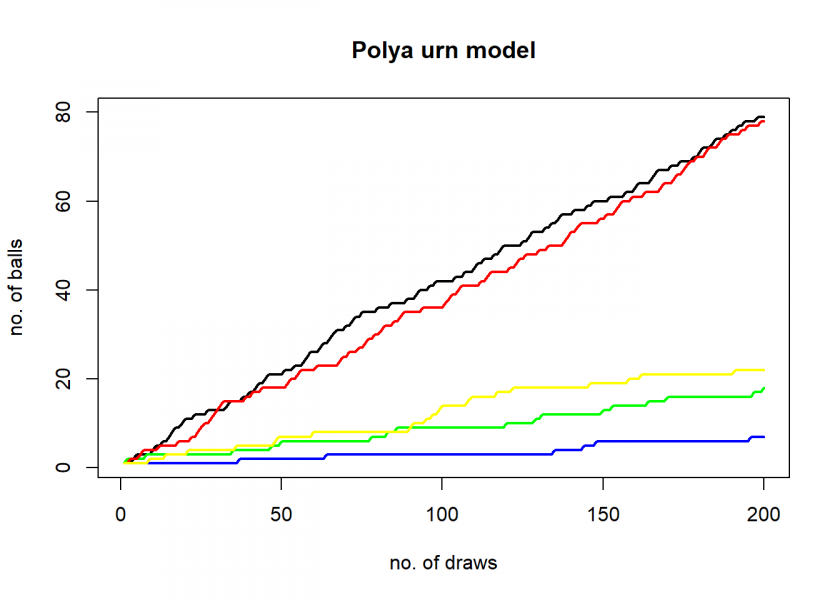
This one is really interesting! Black and red are neck and neck! Obviously, there is more going on than just one colour dominating the rest from start to finish.
Now, let us make the initial filling more pronounced, three balls of blue instead of one:
polya_urn(cols = c("black", "blue", "blue", "blue", "green", "red", "yellow"))
Clearly, blue is the winner. But that does not have to be the case, here with three red balls instead of one:
polya_urn(cols = c("black", "blue", "green", "red", "red", "red", "yellow"))
At the beginning (till about step 20) red and blue are neck and neck, then blue starts to dominate and red and green are neck and neck. After about step 90 green even overtakes red!
Sometimes, even in these “biased” models, randomness takes its toll and we see more complicated dynamics playing out. This interplay of randomness and the self-reinforcing property makes these models so interesting and fascinating.
I hope that you enjoyed this post and it got you thinking. Please share your thoughts and the results of your own experiments in the comments below!
Nice post! I’m thinking that there is some relationship between initial conditions, the Dirichelet distribution and the likely distribution of Gini coefficients. Sounds like a simulation exercise, though like any reasonable idea, Google will probably tell me someone has already done it!
Thank you, Mark!
This seems really interesting, why don’t you conduct your own experiments with the above code and share your results with us!
Hello! Very nice post, thank you so much for making this, it’s exactly what I’ve been looking for my work. One question from someone not so proficient with R: there’s a variety of urn model where sampling a given color triggers the addition of new, previously not present colors in the urn. Do you have any hints how one might go about in adding that feature to the code?
Thank you, Bruno, for your great feedback!
Interesting idea: one approach would be to add additional columns to the
urnmatrix and updatecols_uniqueaccordingly.Hello! Please, how would you display the results in a graph showing proportions of colors from all drawned balls and not their absolute number? And is it possible to display lines of x iterations of the same experiment in a single graph? Not always making a new one?