

With COVID-19 after the vaccination is before the vaccination. Now that most people in the developed countries have been vaccinated the question arises of how much boost is in the booster shot. We are here to help you understand the real power (or lack thereof) of the booster, so read on!
Very recently a new study was published in The New England Journal of Medicine: Protection of BNT162b2 Vaccine Booster against Covid-19 in Israel:
At least 12 days after the booster dose, the rate of confirmed infection was lower in the booster group than in the nonbooster group by a factor of 11.3 […] the rate of severe illness was lower by a factor of 19.5 […].
Wow, a risk reduction by a factor of 20! That is really impressive, is it not? But what exactly is the basis on which the factor is being calculated?
To bring some light into the matter renowned statistician Katharina Schüller did the maths in the article Dritte Covid-19-Impfung – Ein kleiner Boost:
- With two vaccine doses, the risk of infection was around 85 cases per 100,000 person-days and with three doses around 8 cases per 100,000 person-days.
- With two doses, the risk of severe disease was around 6 cases per 100,000 person-days and with three doses around 0.3 cases per 100,000 person-days.
We go one step further here and illustrate the point visually to get an intuitive feel for the situation.
We already talked about the efficacy of the COVID-19 vaccine on this blog and explained the concepts of relative vs. absolute risk reduction (and its dangers): COVID-19 vaccine “95% effective”: It doesn’t mean what you think it means! There we saw that personograph plots (also called Kuiper-Marshall plots) are an excellent way to communicate risks (the personograph package can be installed from CRAN).
Let us start with the risk of infections without and with an additional booster shot, based on 2,500 fully vaccinated people:
library(personograph)
## Loading required package: grImport
## Loading required package: grid
## Loading required package: XML

n <- 2500
inf_wo_boost <- 64 / n
inf_w_boost <- 6 / n
inf_wo_boost / inf_w_boost # rel. risk reduction
## [1] 10.66667

data <- list(first = inf_w_boost, second = inf_wo_boost-inf_w_boost, third = 1-inf_wo_boost)
personograph(data, colors = list(first = "red", second = "orange", third = "lightgrey"),
             fig.title = "Infections w/o booster: < 64/2500, with booster: ~ 6/2500",
             draw.legend = FALSE, n.icons = n, dimensions = c(25, 100),
             plot.width = 0.97)
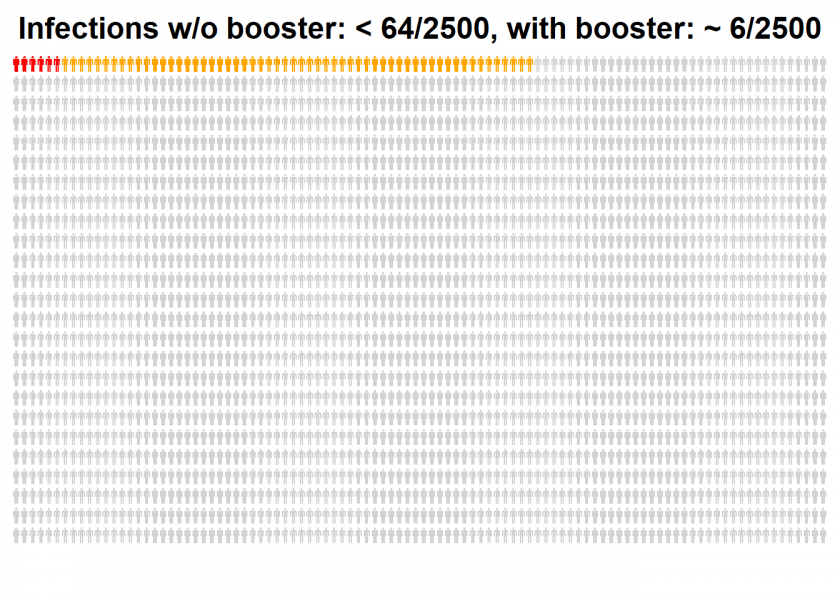
All persons are fully vaccinated, orange and red persons are the unlucky ones who still get an infection (a so-called breakthrough infection), while the orange cases can be prevented by a booster dose.
What is the absolute risk reduction in percentage points?
100 * ((n - inf_wo_boost*n) / n - (n - inf_w_boost*n) / n) # perc. points risk reduction
## [1] -2.32
The initial relative risk reduction by a factor of 11 became only about two percentage points absolute risk reduction. Now the same analysis for the even more important severe cases:
ev_wo_boost <- 5 / n
sev_w_boost <- .25 / n
sev_wo_boost / sev_w_boost # rel. risk reduction
## [1] 20

data_2 <- list(first = sev_w_boost, second = sev_wo_boost-sev_w_boost, third = 1-sev_wo_boost)
personograph(data_2, colors = list(first = "red", second = "orange", third = "lightgrey"),
             fig.title = "Severe cases w/o booster: < 5/2500, with booster: < 1/2500",
             draw.legend = FALSE, n.icons = n, dimensions = c(25, 100),
             plot.width = 0.97)
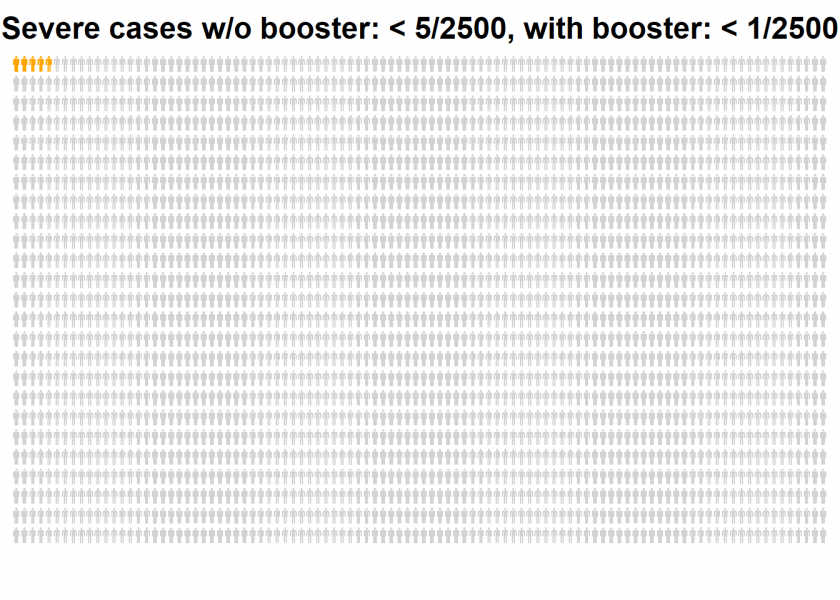
The remaining risk of a severe illness after the booster shot is too small to be plotted. We would have to add at least another 7,500 persons to get one red one!
Again, what is the absolute risk reduction in percentage points?
100 * ((n - sev_wo_boost*n) / n - (n - sev_w_boost*n) / n) # perc. points risk reduction
## [1] -0.19
So, the initial relative risk reduction by a factor of 20 became a meager 0.2 percentage points absolute risk reduction! This is not because the efficacy of the booster is so bad but because the standard vaccination without the booster is already so powerful that it can only add a comparatively small advantage. The huge relative risk reduction prominently shown in the article above is not wrong per se but sure it is misleading.
This squares well with another result I found together with my colleagues Dr. Tobias Krebs and Professor Michael Möckel (both also Technical University Aschaffenburg), where we compared different vaccine regimes. We concluded that “vaccinations of unvaccinated people is more effective than booster vaccinations for already fully vaccinated people”. You can read the full preprint here: COVID-19 scenarios for comparing the effectiveness of age-specific vaccination regimes, exemplified for the city of Aschaffenburg (Germany).
Please share your thoughts on this in the comments and stay tuned for more interesting insights!
By a factor of 19.5 means 19.5 times less not 19.5% less
Fair point, thank you Lyudmil! I corrected the text.
Very good read. The supporters of boosters can still argue that SOME groups can benefit far more than the average shows, but we would need far more granular data to verify that claim. The analysis also shows how much public health policies have deviated from their initial core principles. It used to be about cost-benefit analysis, now even most meager increases in benefit are supported on moral/political grounds with complete disregard for the costs and scientific evidence behind them. Only this week Israel announced it would cancel all previous vaccination certificates and only way to renew them will be to get a booster. Virtually a mandate to get the third dose. We’ll see how many countries will follow suit.
Thank you for your good feedback, Adam, I appreciate it.
It is not my job to give any policy recommendations, especially not to foreign countries. The sole purpose of the article was to put the results of the abovementioned study into perspective.
“vaccinations of unvaccinated people is more effective than booster vaccinations for already fully vaccinated people”
Sure, but it isn’t one or the other. You can do both. Unvaccinated individuals are an increasingly difficult population to provide vaccines to and in countries with sufficient supply, there is very little downside to boosting immunity.
Secondly, it is important to get out ahead of issues, not just look back at rates as they have been. If protection continues to wane in the two dose population and infection induced resistance increases in the unvaccinated population, the relative utility of widespread booster shots could greatly increase.
Thank you for your comment, Ian.
To your first point: Well, in the light of scarce resources you have to prioritize. Your second point is certainly valid.
Thank you for very enlightening post and food for thought on how things so easily gets blown out of proportion. I always find it beautiful when one reaches super obvious conclusions and realise “hey, well of course a dividing a small number with another small number gives a large number!”
But regarding the code and maths shown. I seem to miss the step where you translate the 85 cases per 100,000 person-days to the number 64 out of 2500 in the code snippet. And also for the other conversions into “out of 2500” level. Can you help me?
Thank you for your great feedback, Lars, I really appreciate it.
Yes, I did not take all the intermediate steps from the article:
Originally, there was also a small error in this calculation, which was corrected after I pointed it out 😉
Now I just divided by 4…
In your example you are only considering a 30 day window for the absolute risk. COVID-19 will not be gone in 30 days.
If you consider a longer time period, e.g. 180 days to cover the time until spring the absolute risk reduction is 6 times higher. If the booster will give benefit for multiple years and COVID-19 becomes endemic (very likely), the absolute risk reduction can be 50 times higher or more as in your example.
No, the absolute risk reduction stays the same. With 180 days you would have to multiply everything (!) by 6:
With two vaccine doses, 1530 infections are expected, with three doses 144 infections.
With two vaccine doses, 108 severe cases are expected, with three doses 6 severe cases.
The amount of infections and severe cases are multiplied, but the amount of people stays the same. Therefore, the absolute risk reduction per person increases over time.
E.g. with 10.000 people
30 days: 18 severe cases with two doses, 1 severe case with three doses
180 days: 108 severe cases with two doses, 6 severe cases with three doses
Absolute risk reduction in 30 days: 0.17%
Absolute risk reduction in 180 days: 1.02%
In reality there are some more effects: E.g. someday everyone is infected, waning immunity both for two doses and most likely for three doses.
Yes, this is correct, thank you for the heads-up. Still, one percent is still quite small and way off the originally reported factor of 20!
The originally reported factor of 19.5 reduction is the correct relative risk reduction.
BTW: The original study is also mentioning the absolute risk reduction, but in a better way than just giving one percentage number and instead using person-days as a reference:
“The absolute between-group difference in the rate of severe illness was 7.5 cases per 100,000 person-days.”
Whether this risk reduction is small or not depends on how much effort a society wants to spend to avoid illness & death. E.g. there had been 144 deaths of two-dose vaccinated persons in Germany in the last 4 weeks (RKI). About 130 of these deaths could have been prevented with a booster dose.
I never claimed that the reported factor was wrong per se, I wrote that it is misleading.
The calculation suffers from a common fallacy concerning how to estimate risk. Risk is defined as the product of the probability of an event and the magnitude of the damage it causes. From an epidemiological perspective, you can estimate such damage in lives per population and perform the kind of calculation you did. But from an individual’s perspective, there is only one life to consider – ones own – and losing that unique life effectively corresponds to an infinite damage. The only rational approach is to protect that life at all cost, until the side-effects of the protective behaviour outweigh the benefits. In practice, this gets a bit more complicated of course, since other altruistic considerations may enter the argument – the key point however stands: as soon as infinities are involved, the notion of risk becomes ill-posed and thus the epidemiological and individual perspectives are incommensurable.
I, for sure, will get a booster shot as soon as I can get one. It’s the only way to be sure 🙂
The only thing I do here is to show that the relative risk reduction given in the article is misleading and that it would be good practice to also show the absolute risk reduction.
This is, by the way, one of the rules medical journals have committed themselves to: The CONSORT Statement. This rule was not adhered to here.
The original study is following the rules of the CONSORT Statement and is showing the absolute risk reduction. See Results section in the study.
I have had a second look at the study and you are right. I am a little confused why the cited “Unstatistik”-article claims the opposite and will ask them for clarification.
Still, it is telling why the authors of the study trumpet the big relative numbers so prominently in the abstract and bury the small absolute numbers somewhere deep down in the paper.
I have again read through my blog post and I still think it is valid. Especially the visualizations add value.
I would say the relative number is more meaningful and more general.
The absolute risk reduction depends very much on the virus spread at the time and location of the study.
In Israel during this time they could prevent 86,6 infections per 100,000 person days. With the same booster vaccination, but study done in China or New Zealand or in Israel three months earlier the absolute risk reduction would be basically zero.
The absolute risk reduction of a measles vaccine was reduced by a factor of nearly 100 from 2001 to 2020 in Germany. Not because the vaccine got worse, just because the measles spread went down over the years.
The relative risk reduction better explains the quality of the booster vaccination itself, independent of the setting it is being used in.
I agree with Hendrik. Calculating the reduction of risk in the total population is not the same as studying the effect of the booster. The risk for infection also depends strongly on the risk to be exposed to the virus. An effect of the booster cannot be expected if people were not exposed. To calculate meaningful absolute numbers we would need to know exposure, which is extremely difficult to study.
Not having this data makes the relative risk a good measure to estimate the effect of the booster if you were exposed to the virus and that is what people intuitively think when they read these numbers.
In conclusion: The published numbers are correct and intuitive. The absolute numbers in the “Unstatistik” are based on an incorrect assumption. That is that the booster effect can be estimated in a population where the majority was not even exposed.