

After my little rant (which went viral!) about the tidyverse from last week, we are going to do a little fun project in the 50’th 🙂 post of this blog: ASCII Art! If you want to have some fun by painting with letters (i.e. ASCII characters) in R and get to see a direct comparison of tidyverse and base R code, read on!
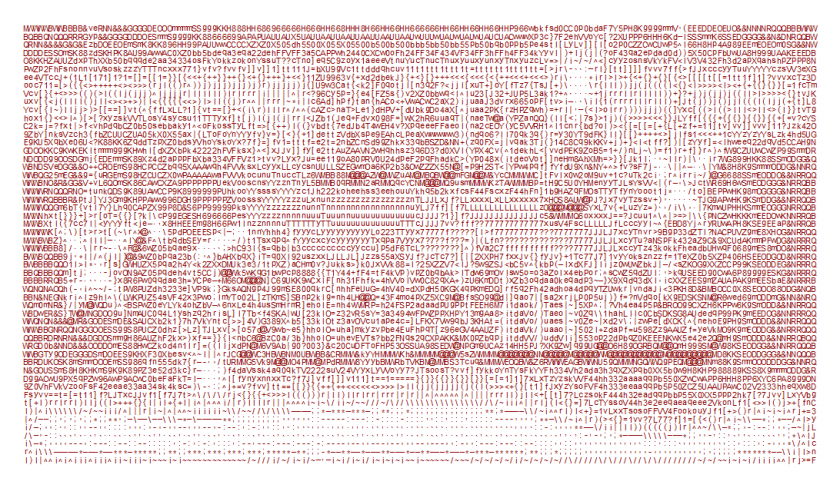
ASCII Art is the art of painting pictures with letters, or more specifically, with Ascii characters. This works because different characters consume smaller or bigger areas, e.g. compare a dot “.” to the “@” sign! So the basic idea is to evaluate the brightness of each pixel (or blocks of pixels) and replace it with an ASCII character. Simon Barthelmé (who is also the author of the imager package!) has written an excellent post on how to do that with R: Generating ASCII art using imager and ggplot2.
Here I will give you a 100% tidyverse free version of this code in base R! I don’t add any additional comments because it is more or less a direct translation of the original code. I don’t go into the details either because this would go beyond the scope of this post.
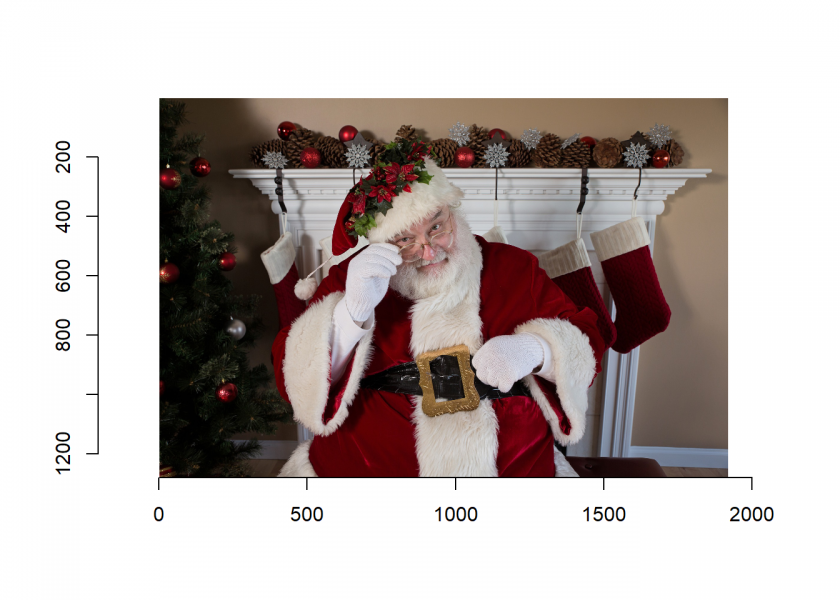
You can find the image we will be using on Pixabay: Santa Claus. Before using imager (on CRAN) it might be necessary to install GraphicsMagick first.
library(imager)
## Loading required package: magrittr
##
## Attaching package: 'imager'
## The following object is masked from 'package:magrittr':
##
##     add
## The following objects are masked from 'package:stats':
##
##     convolve, spectrum
## The following object is masked from 'package:graphics':
##
##     frame
## The following object is masked from 'package:base':
##
##     save.image

im <- load.image("D:/Downloads/santa-claus-1628845_1920.jpg")
plot(im)
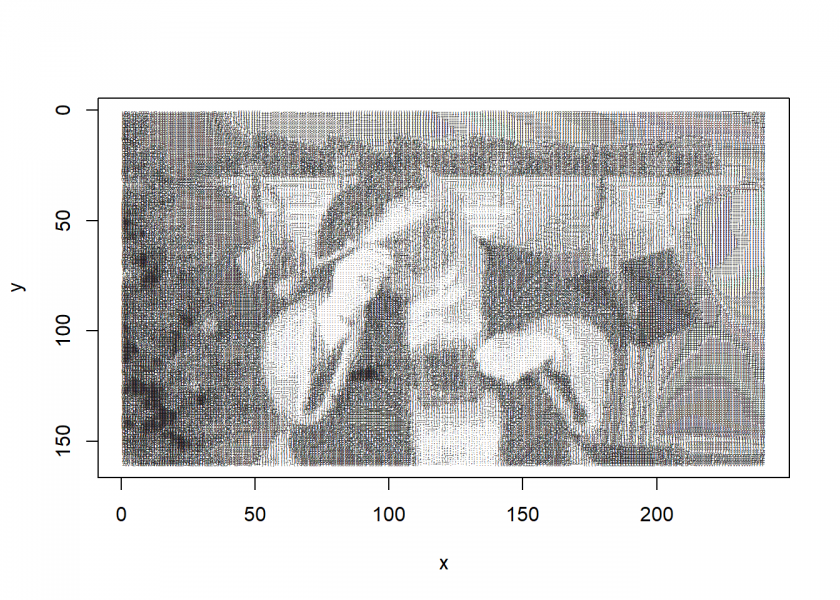
asc <- gtools::chr(38:126)
g_chr <- function(chr) mean(grayscale(implot(imfill(50, 50, val = 1), text(25, 25, chr, cex = 5))))
g_chr <- Vectorize(g_chr)
g <- g_chr(asc)
n <- length(g)
char <- asc[order(g)]
d <- as.data.frame(imresize(grayscale(im), 0.1))
d$qv <- cut(d$value, c(quantile(d$value, seq(0, 1, 1/n))), include.lowest = TRUE, labels = FALSE)
d$char <- char[d$qv]
plot(d$x, d$y,  xlab = "x", ylab = "y", ylim = rev(range(d$y)), type = "n")
text(d$x, d$y, d$char, cex = 0.25)
I think the base R code is certainly different but no less elegant and in some cases, it is even clearer what is going on. If you have any comments, please let me know below!
Merry Christmas, Happy Holidays, and a Happy New Year to you all, and I will be back on the 7’th of January 2020… stayed tuned!
Hi, I followed all steps and I am having error msg
Can you check and let me know what went wrong? I use my own picture.
im <- load.image("~/rtraining/intro2r/pictures/stars.jpg") plot(im) asc <- gtools::chr(38:126) g_chr <- function(chr) mean(grayscale(implot(imfill(50, 50, val = 1), text(25, 25, chr, cex = 5)))) g_chr <- Vectorize(g_chr) g <- g_chr(asc) n <- length(g) char <- asc[order(g)] d <- as.data.frame(imresize(grayscale(im), 0.1)) d$qv <- cut(d$value, c(quantile(d$value, seq(0, 1, 1/n))), include.lowest = TRUE, labels = FALSE) d$char <- char[d$qv] plot(d$x, d$y, xlab = "x", ylab = "y", ylim = rev(range(d$y)), type = "n") text(d$x, d$y, d$char, cex = 0.25)Have you tried to do it with my picture first?
What I can imagine is that the colour range of your picture is not big enough.