
Many wonder why there are so few protests in Russia over the brutal war against Ukraine. An answer could lie in the youth bulge theory which we will use again to explain the relative lethargy of the Russian populace, so read on!
Since the beginning of the war against Ukraine observers have wondered why there isn’t more political unrest in Russia, i.e. more criticism, more protests, and more opposition in general to this unjust war against its peaceful neighbour.
Several reasons come to mind like police brutality against protestors, long prison sentences for members of the opposition, and constant brainwashing with propaganda but there could be one hidden force: the proportion of young people.
In this post, we won’t retell the whole background story of the youth bulge theory because we have done that already here: The “Youth Bulge” of Afghanistan: The Hidden Force behind Political Instability.
The gist is that the bigger the proportion of young people over older people, the more violent political and social conflicts there will be. In the above post, we showed a highly significant correlation between those two based on World Bank data. On top of that, we found a tipping point at about 24% for the age group 0-14.
Now, let us see how the situation in Russia is based on the latest 2020-numbers:
library(WDI) # install from CRAN
age0_14 <- WDI(indicator = "SP.POP.0014.TO.ZS", start = 2020, end = 2020) # proportion of 0-14 year olds
pol_stab <- WDI(indicator = "PV.EST", start = 2020, end = 2020) # political stability indicator

data <- merge(age0_14, pol_stab)[c(1, 5, 6)] |> na.omit()
colnames(data) <- c("country", "age0_14", "pol_stab")

plot(data$age0_14, data$pol_stab, col = "darkgrey", xlab = "Proportion of young people (in %)", ylab = "Political stability", main = "Youth bulge theory")
abline(v = 23.9, col = "red")
lm.out <- lm(pol_stab ~ age0_14, data = data)
abline(lm.out, col = "blue", lwd = 3)

country <- "Russian Federation"
points(data$age0_14[data$country == country], data$pol_stab[data$country == country], col = "red", lwd = 8)
text(data$age0_14[data$country == country], data$pol_stab[data$country == country], labels = country, pos = 4)
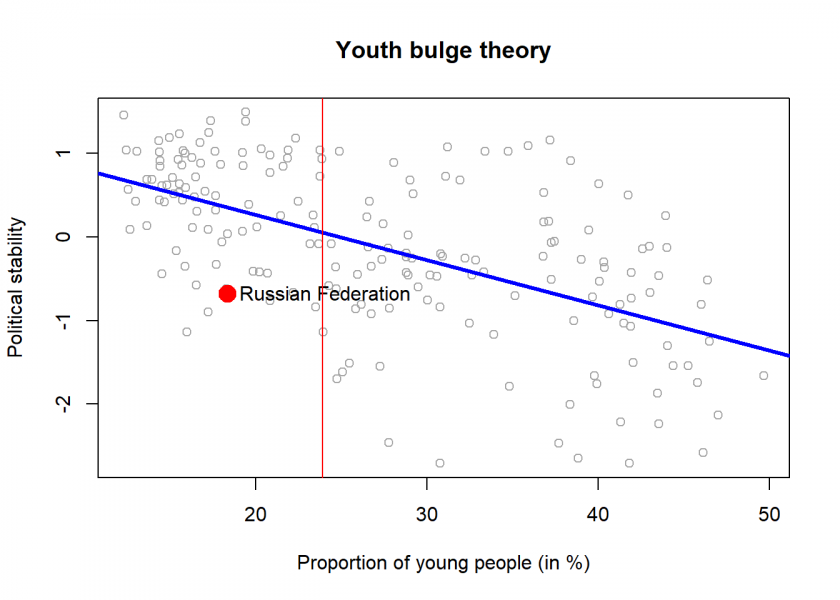
As we can clearly see in this plot the proportion of 0–14-year-olds with about 18% is way below the critical tipping point of 24% (= the narrow red line). That alone of course doesn’t give a “guarantee” that there won’t be any serious uprising or revolution but it can provide a good heuristic with about 80% accuracy.
On the other hand, this is the reason why the country is not enthusiastically embracing the war either and therefore seems to be losing it. When you look at the scenes of the recruitment centres now that Putin has ordered a mobilization you mainly see tired-looking men, so lethargy goes both ways.
What do you think about the youth bulge theory in this context? Please let us know in the comments!
DISCLAIMER
The views and opinions expressed in this blog post are those of the author and do not necessarily reflect the official policy or position of any organization. This blog post is for informational purposes and is an analysis based on available data, it is not intended to be an exhaustive explanation. The subject matter is highly sensitive and complex, and readers are encouraged to consider multiple perspectives when evaluating the issues.
UPDATE October 8, 2022
I created a video for this post (in German):
UPDATE November 29, 2022
And yet another application of the youth bulge theory, this time about the situation in China: How Stable is China?.
The y-axis is labeled “political stability” and the trend is decreasing when there are *more* young people.
However in the text you state the opposite,
“the bigger the proportion of young people over older people is, the more violent political and social conflicts there will be”
Ah I see now that the trend in the image is not opposite to the text. But the position of Russia is on the left which means that it has a relatively old population and not so many young people.
Compared to other countries with similar percentages of young people, Russia is at the lower end, far away from the trend line. So it doesn’t seem to be that Russia has a young population, and it it is that Russia is an outlier in this relationship.
Thank you for your comment, Martijn.
I wouldn’t say that it is “far away from the trend line” and an “outlier”. It is obviously not exactly on the trend line (we don’t have a correlation of 1 but of about 0.6) but when you look at the whole picture it is certainly within the overall trend corridor.
You appear to have a bug in your code. When I copy/paste it into R here, I get:
Thank you (in advance) for the assistance.
Unfortunately, I cannot reproduce the error. Did you install the
WDIpackage from CRAN?Ahahaha – it is really funny: “peaceful neighbour”…
Not only russians were brainwashed of propaganda.
Well, Russia invaded Ukraine, I cannot see what is funny about that.
Look at world maps depicting:
– median age
– total fertility
– legal status of abortion
– women’s rights
– level of armed violence
– murder rate
Correlations jump into the eye, but it would be interesting to do correlations analyses on them the same way you did for political instability and proportion of young people. Those correlations then need to be explained in terms of historical analyses.