

COVID-19 has the world more than ever in its grip – but there is hope: several vaccines have been developed which promise to deliver “95% efficacy”.
When people read this many assume that it means that 95% of vaccinated persons will be protected from infection – but that is not true. Even many (science) journalists get it wrong! If you want to understand what it really means, read on!
Let us take the example of the German biotech company BioNTech which developed its mRNA vaccine BNT162b2 in cooperation with pharmaceutical giant Pfizer. First of all, let me make it very clear that this is an extraordinary achievement and I am hopeful that it will prove to be a real game-changer in the fight against this horrible virus. I stress this because nowadays you cannot be cautious enough not to be instrumentalized by all kinds of strange people who have an interest in downplaying this devastating pandemic.
Now, what does a so-called efficacy rate of 95% mean? Let me start by stating what it doesn’t mean: it doesn’t mean that 95 out of 100 vaccinated persons will be protected from COVID-19, nor does it mean that it will reduce the severity of the illness in case you contract the virus despite being vaccinated.
To understand the real meaning let us go through the press release of Pfizer:
Primary efficacy analysis demonstrates BNT162b2 to be 95% effective against COVID-19 beginning 28 days after the first dose;170 confirmed cases of COVID-19 were evaluated, with 162 observed in the placebo group versus 8 in the vaccine group
What Pfizer did was to select about 43,000 voluntary participants where about half received the vaccine and the other half (= the control group) received only a placebo, without any active substance. After about a month after the first dose (i.e. one week after the second dose), they started to count the number of confirmed COVID-19 cases for each group: in the placebo group 162 cases were confirmed, whereas in the vaccine group only 8 cases appeared.
To get to the 95%-number the following calculation was performed:
(1 - 8/162) * 100
## [1] 95.06173
So the 95% is the relative risk-reduction in infections, it doesn’t tell us the absolute probability of not getting infected despite being vaccinated!
We already covered relative vs. absolute risk reduction (and its dangers) in this blog. There we saw that personograph plots (also called Kuiper-Marshall plots) are an excellent way to communicate risks.
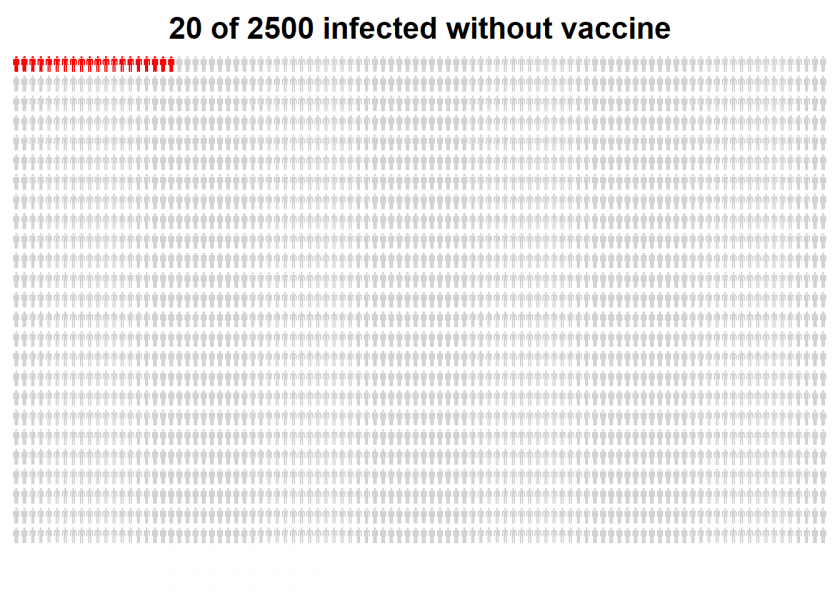
Let us start by illustrating the confirmed COVID-19 cases in the placebo (= control) group for a better manageable group size of 2,500…
library(personograph) # first install from CRAN
## Loading required package: grImport
## Loading required package: grid
## Loading required package: XML

n <- 2500
inf_wo_vac <- 20 / n

data <- list(first = inf_wo_vac, second = 1-inf_wo_vac)
personograph(data,  colors = list(first = "red", second = "lightgrey"),
             fig.title = "20 of 2500 infected without vaccine",
             draw.legend = FALSE, n.icons = n, dimensions = c(25, 100),
             plot.width = 0.97)
…and now for the vaccine group of the same size:
inf_w_vac <- 1 / n

data <- list(first = inf_w_vac, second = 1-inf_w_vac)
personograph(data,  colors = list(first = "red", second = "lightgrey"),
             fig.title = "1 of 2500 infected despite of vaccine",
             draw.legend = FALSE, n.icons = n, dimensions = c(25, 100),
             plot.width = 0.97)
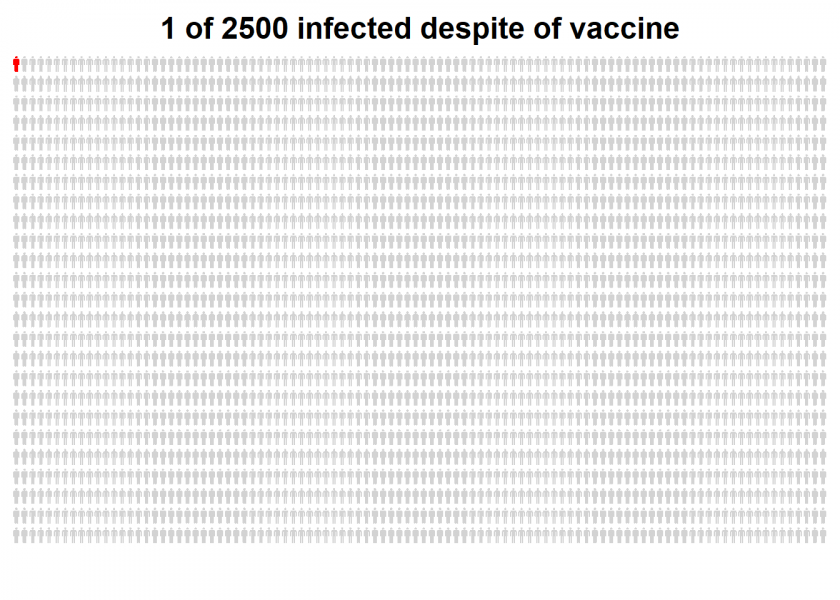
I think that those plots really put matters in perspective.
The main problem is that vaccine studies cannot directly measure what we really want to know: the effectiveness of the vaccine in the real world, i.e. how well it protects us from contracting the disease. Therefore they use efficacy as a proxy instead, i.e. relative risk-reduction of infections in the two study groups. This can give a good indication of the order of magnitude of the real-world effect but is not the same!
So while “95% effective” indeed does mean something different from what most people think it means let us hope that it translates into a real turning point for the better.
Very interesting and clear. And I like the graph!
Thank you, Elias, I appreciate it!
Great post. Thanks!
Thank you, Iyar, highly appreciated!
Thanks for these thoughts, that are quite related to similar problems of risk communication, e.g. in cancer screening, and prevention in general.
Still, I don’t completely agree with your conclusion.
Formally, you are right in that the 95% are the relative risk reduction as outlined in the publication (Polack et al. New England Journal of Medicine; December 10, 2020).
On the contrary, in my view the personograph does not represent what people seek for, either, including the arbitrary choice of a n=2.500 base. My experience is that people would interpret s.th. like the “95% effective” phrase, like that the vaccine would be “working” in 95% of the vaccinated individuals. “Working” would mean not gettig infected if exposed in a relevant way.
Although, we can’t really say s.th. about individuals “exposed in a relevant way” from the Pfizer phase 3 trial, the randomized design would practically allow for using the number of infected persons in the placebo arm as a fairly representative proxy.
Best, Michael
If so, the n=162 from the placebo group would be best guess of a number also applying to the vaccinated group and therefore you could well communicate that the vaccine hypothetically worked in n=154 of those hypothetical 162 vaccinated individuals exposed to SARS-Cov-2, which again would mean that “it worked” in 95.1% of them.
Dear Michael, thank you for your comment!
I agree that people are not looking for that but I still think that the above plots represent the outcome of those trials in a proper way. The base n = 2500 is not that arbitrary but is the smallest whole number which allows for the representation of just one person in the second plot.
I also agree that the outcome of those trials is a good proxy for what we really want to know, I guess even the best one can come up with without employing unethical study designs.
best h
P.S.: Sent you a LinkedIn invite!
Vaccine Efficacy is the percentage reduction of disease in a vaccinated group of people compared to an unvaccinated group. Therefore, we indeed need to see VE as a risk reduction relatively.
Indeed, very succinct summary. Thank you KS Lam.
Dear Holger,
thanks for a very interesting post! I generally like this blog a lot, and am recommending it to my students as a source of inspiration for data science projects. That said, a vaccination efficacy of 95% “doesn’t mean what you think it means” either, unfortunately.
Essentially, your above calculation of 1 – 8/162 computes vaccine efficacy as the complement to the simple post-test _odds ratio_ (`OR` = `N infected in vaccinated group` / `N infected in placebo group`). By contrast, the efficacy of vaccines is typically defined as the _relative risk reduction_ (`RRR`) attributed to the effect of the vaccination.
Although both these measures can be very similar, they are not identical (see Table 3 of https://doi.org/10.3389/fpsyg.2020.567817 for their definitions in terms of a 2×2 matrix). Their values happen to be identical when the vaccinated and placebo groups are exactly of the same size (i.e., `p_vacc = p_placebo = 1/2`). In most actual studies, however, the number of vaccinated people does not exactly match the number of individuals in the placebo group. Whereas your measure of `1 – OR` ignores group sizes, such imbalanced designs would yield different RRR values.
As most designs for evaluating vaccines strive for balance, the numeric deviations between both measures are typically small. However, as the title of your post implies to explain the meaning of “vaccine efficacy”, it seems worth pointing out that RRR would account for imbalanced designs, whereas the measure computed above only applies to a special case (when `p_vacc = 1/2`).
As the measure of `RRR` really _is_ very hard to understand, the icon arrays you show may help in rendering its consequences more transparent. (I somewhat doubt that seeing these consequences helps people to better understand the concept of `RRR` itself, but that would be yet another discussion.) A neat feature of using RRR is that its magnitude is independent of the overall population size `N`, which allows scaling down to more suitable subpopulations (as you do for creating the graphs).
I hope this clarifies things further — and I’m looking forward to future posts,
Hans
Dear Hans,
Thank you very much for your great feedback and your recommending my blog to your students, I really appreciate that a lot!
Now to your point: my post was inspired by the great statistical series “Unstatistik des Monats” (something like “unstatistic of the month”): Der Impfstoff ist „zu 90 Prozent wirksam“ by my renowned colleague Professor Gerd Gigerenzer, former Director at the Max Planck Institute (unfortunately only available in German).
I think the approximation is good enough anyway because both groups were indeed about the same size. On top of that, the topic is quite complicated already, so I don’t want to complicate it any further.
Looking forward to your comments (or that of your students) on future posts
…just saw that you worked for Professor Gigerenzer, so you know each other! Good stuff…