

In view of the current dramatic events in Afghanistan many wonder why the extensive international efforts to bring some stability to the country have failed so miserably.
In this post, we will present and analytically examine a fascinating theory that seems to be able to explain political (in-)stability almost mono-causally, so read on!
The theory we are talking about states that a so-called “youth bulge”, which describes an excess in the young population of a country, is the real (and main) hidden force behind political instability. The term was first used by Gary Fuller in 1995, then adopted by the renowned political scientist Samuel Huntington, and later extended and popularized by German sociologist and economist Gunnar Heinsohn in his book “Söhne und Weltmacht” (2003, new ed. 2019).
The basic idea is that resources are limited and are owned and managed by (older) adults. This is also true for (political) power. Young people want a piece of the action. The bigger the imbalance, i.e. the more young people there are, the bigger the conflicts because more young people fight for their place in the economy and society. If there is a balance the transition of power and resources can be organized more smoothly and if a society is even dominated by older people (like e.g. in Germany) the young just don’t have a say in those matters
Professor Heinsohn provides several convincing (and also many historical) examples in his book, here we will (as always) take a current data-centric approach and use official data from the World Bank to see whether there is some merit to the theory. We will also look at the case of Afghanistan (and Germany) in this context.
There are several definitions for “youth bulge” out there, we will use the following: “Proportion of age group 0-14 (% of total population)” whose data can directly be downloaded from the World Bank via the excellent WDI package (on CRAN) which makes use of their official API. Heinsohn uses the age group 15-24 (and especially males) but both proportions are highly correlated and those numbers are much harder to come by.
The other indicator we need is an estimate of the political stability of a country, we will also use the official World Bank indicator for that: “Political Stability And Absence Of Violence/Terrorism: Estimate (PV.EST)”:
Political Stability and Absence of Violence/Terrorism measures perceptions of the likelihood of political instability and/or politically-motivated violence, including terrorism. Estimate gives the country’s score on the aggregate indicator, in units of a standard normal distribution, i.e. ranging from approximately -2.5 to 2.5.
So, let us get our hands on the data and do some inspection of it first (the 2020 data are not yet available at the time of writing but that should not bother us because we are concerned with a relatively robust demographic structure here):
# needs R 4.1.0 or higher to run
library(WDI)

age0_14 <- WDI(indicator = "SP.POP.0014.TO.ZS", start = 2019, end = 2019) # proportion of 0-14 year olds
pol_stab <- WDI(indicator = "PV.EST", start = 2019, end = 2019) # political stability indicator

data <- merge(age0_14, pol_stab)[c(2, 4, 5)] |> na.omit()
colnames(data) <- c("country", "age0_14", "pol_stab")

data |> summary()
##    country             age0_14         pol_stab
##  Length:188         Min.   :12.33   Min.   :-2.76829
##  Class :character   1st Qu.:17.62   1st Qu.:-0.64972
##  Mode  :character   Median :26.20   Median :-0.08217
##                     Mean   :27.43   Mean   :-0.10738
##                     3rd Qu.:37.10   3rd Qu.: 0.69295
##                     Max.   :49.84   Max.   : 1.65590

data[order(data$pol_stab), ] |> head(15)
##                      country  age0_14  pol_stab
## 201              Yemen, Rep. 39.22337 -2.768294
## 175     Syrian Arab Republic 31.05803 -2.727996
## 3                Afghanistan 42.47227 -2.649407
## 113                    Libya 28.06828 -2.565753
## 86                      Iraq 38.02093 -2.564838
## 172              South Sudan 41.56805 -2.558902
## 170                  Somalia 46.37951 -2.383227
## 147                 Pakistan 35.05438 -2.246336
## 34  Central African Republic 43.92002 -2.182968
## 121                     Mali 47.30470 -2.153436
## 150       West Bank and Gaza 38.64966 -1.942078
## 135                  Nigeria 43.68753 -1.934674
## 33          Congo, Dem. Rep. 46.00140 -1.808007
## 87        Iran, Islamic Rep. 24.65466 -1.698151
## 162                    Sudan 40.15571 -1.673614

data[order(data$age0_14), ] |> head(15)
##                  country  age0_14   pol_stab
## 77  Hong Kong SAR, China 12.32671 -0.2677673
## 164            Singapore 12.33150  1.5316020
## 92                 Japan 12.57303  1.0412250
## 99           Korea, Rep. 12.74644  0.4780881
## 89                 Italy 13.16666  0.4626993
## 151             Portugal 13.25209  1.1282480
## 154                Qatar 13.59590  0.7046954
## 47               Germany 13.79949  0.5828653
## 72                Greece 13.89660  0.2909985
## 124     Macao SAR, China 14.01947  1.2506430
## 126                Malta 14.32879  1.0901870
## 10               Austria 14.36186  0.9801227
## 81               Hungary 14.43322  0.7325271
## 79               Croatia 14.56222  0.7554738
## 57                 Spain 14.57687  0.3228728
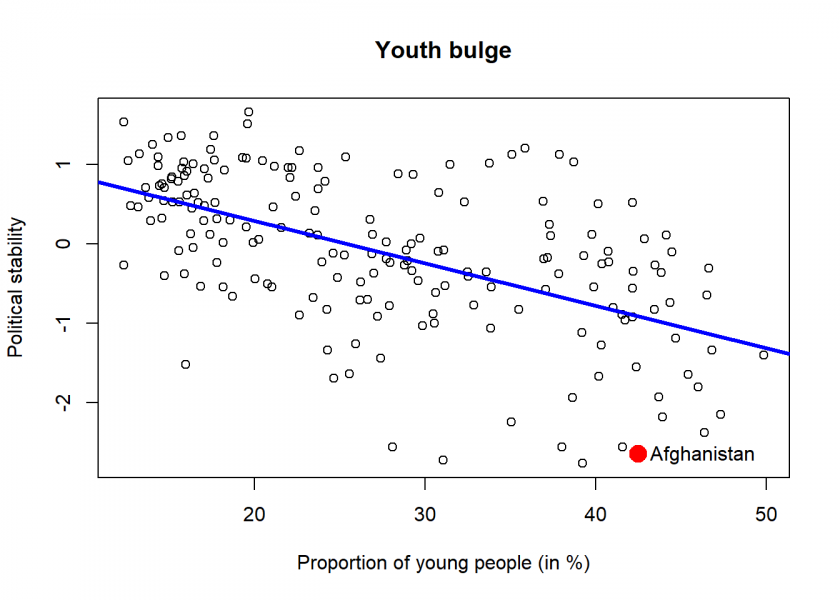
Altogether we have data for 188 countries: the first table shows the first 15 countries ordered by political instability. As we can see, those are the countries that keep making it into the news because of violence, terrorism, and war. It is notable that the proportion of young people is consistently very high (around 40%). Afghanistan is in third position here!
The second table shows the first 15 countries ordered by the proportion of young people: With the notable exception of Hong Kong, those are all politically stable countries.
Now let us analyze the dependence structure of those two variables:
plot(data$age0_14, data$pol_stab, xlab = "Proportion of young people (in %)", ylab = "Political stability", main = "Youth bulge")
lm(pol_stab ~ age0_14, data = data) |> abline(col = "blue", lwd = 3)
country <- "Afghanistan"
points(data$age0_14[data$country == country], data$pol_stab[data$country == country], col = "red", lwd = 8)
text(data$age0_14[data$country == country], data$pol_stab[data$country == country], labels = country, pos = 4)
cor.test(data$age0_14, data$pol_stab)
##
##  Pearson's product-moment correlation
##
## data:  data$age0_14 and data$pol_stab
## t = -9.382, df = 186, p-value < 2.2e-16
## alternative hypothesis: true correlation is not equal to 0
## 95 percent confidence interval:
##  -0.6566176 -0.4610512
## sample estimates:
##        cor
## -0.5667656
As we can see, both variables are indeed highly negatively (nearly -0.6) and significantly correlated! As we know correlation doesn’t necessarily mean causation but it is a clear indication that there really is some kind of (linear) association between a high proportion of young people and political unrest.
The red dot represents Afghanistan which unfortunately seems to be a (negative) role model for this phenomenon. The theory could be interpreted in a way that the radical Taliban are not the “real” reason for the political unrest but that the youth bulge is the hidden force behind terrorism and political instability.
To bring the point home, the Taliban would according to this theory “only” be some kind of historically path-dependent but ultimately contingent representation of political unrest. If it weren’t for the Taliban there would be some other group of political extremists spreading fear and terror.
Let us finally determine a tipping point (a.k.a. cut-off value) for the proportion of young people which signifies the shift from stable to unstable political circumstances. We will use the OneR package (on CRAN) for that:
library(OneR)

data$pol_stab_bin <- cut(data$pol_stab, breaks = c(-Inf, 0, Inf), labels = c("unstable", "stable"))
optbin(pol_stab_bin ~ age0_14, data = data, method = "infogain") |> OneR() |> summary()
##
## Call:
## OneR.data.frame(x = optbin(pol_stab_bin ~ age0_14, data = data,
##     method = "infogain"))
##
## Rules:
## If age0_14 = (12.3,23.8] then pol_stab_bin = stable
## If age0_14 = (23.8,49.9] then pol_stab_bin = unstable
##
## Accuracy:
## 149 of 188 instances classified correctly (79.26%)
##
## Contingency table:
##             age0_14
## pol_stab_bin (12.3,23.8] (23.8,49.9] Sum
##     unstable          15        * 82  97
##     stable          * 67          24  91
##     Sum               82         106 188
## ---
## Maximum in each column: '*'
##
## Pearson's Chi-squared test:
## X-squared = 62.242, df = 1, p-value = 3.037e-15
The tipping point is at about 24%, which is lower than the often stated number 30% for the age group 0-15 (which is one year more). This number is highly significant and gives an accuracy of nearly 80% when using it as a forecasting instrument for political instability.
On the other hand, this would be good news for countries like Germany (under 14%), where the so-called “Querdenker” COVID protest movement makes some headlines. As serious as one has to take this (German intelligence agencies watch the movement already), the risk of substantial political unrest is very low.
What do you think about the youth bulge theory? Please let us know in the comments!
DISCLAIMER
The views and opinions expressed in this blog post are those of the author and do not necessarily reflect the official policy or position of any organization. This blog post is for informational purposes and is an analysis based on available data, it is not intended to be an exhaustive explanation. The subject matter is highly sensitive and complex, and readers are encouraged to consider multiple perspectives when evaluating the issues.
UPDATE October 7, 2022
Another application of the youth bulge theory can be found here: Youth Bulge theory: Why there won’t be an Uprising in Russia.
UPDATE October 8, 2022
I created a video for this and the post about Russia (in German):
UPDATE November 29, 2022
And yet another application of the youth bulge theory, this time about the situation in China: How Stable is China?.
Beautiful example of how to come up with a thesis and then transparently arguing about the numbers. This is science at it’s best and unfortunately NOT often found in public discussion. (Because it is not easy enough).
I agree here. The young always were the driving force of change – because of a variety of reasons – the lesser their % the lesser entropy in a society. If a society itself then is unstable/violent then the pressure of (violent) change becomes higher. So it is a “nice” combination of change imposed by youth and the behavior of that change which is “using” the momentarily common way of changing things (here violence)
Nice thesis, nice supporting data and correlation. Agreed.
Dear Henning: Your great feedback is highly appreciated, I feel humbled.
What could be the physical/sociologican explanation of this phenomenon? Why is the increase of the numbers of these kids decrease the stability of a nation?
Thanks for the good work.
LP Cruz
Thank you for your feedback and your question.
The basic idea is that resources are limited and are owned and managed by (older) adults. This is also true for (political) power. Young people want a piece of the action. The bigger the imbalance, i.e. the more young people there are, the bigger the conflicts because more young people fight for their place in the economy and society. If there is a balance the transition of power and resources can be organized more smoothly and if a society is dominated by older people the young just don’t have a say in those matters (like in Germany).
Heinsohn adds another aspect of looking especially at males aged 15-24, i.e. implying that young males are more aggressively pursuing their goals. But as I say, the proportions of both groups are highly correlated anyway so that the main results of the analysis stay the same.
I added part of my comment to the original text for clarity. Thanks for the heads-up!
Interesting approach, thanks for sharing, Holger K. von Jouanne-Diedrich. Does this logic not apply for any kind of imbalance in a society including financial inequality, educational inequality, inequality to get the most out of your talents and capabilities? Why should age be an influencing factor of particular importance?
Thank you, Kurt!
This is obviously an interesting question which warrants further investigation. It would be worthwhile to see which one is a better predictor of political instability and, of course, how correlated both variables are.
My gut feeling is that both are quite correlated but that in the end, a youth bulge is the better predictor because older people, even (or especially?) when they are poor, aren’t in the mood for gunning down the elites. Franklin Roosevelt said “war is young men dying and old men talking”… so war “needs” young men, all else is “just talk and no action”.
But as I said, this is an interesting research topic, and I can imagine doing some more posts on those matters.
This is a fascinating take. It reminds me of a book that I have called Why Young Men. Haven’t started reading this one yet but it attempts to explain why we see so much “anti-social” behavior from men of a certain age. Behaviors such as violence and homicides are extremely disproportionate to men of (if I recall correctly) ages 14-25-ish.
Additionally, regarding the syntax in the code, I keep coming up with an error where these (>) are inputted. For example:
Could you help me understand what might be throwing this error? Maybe conceptualizing the syntax reasoning could help me understand as well. To my understanding,
|>is stating an ‘or and greater than’ command?My apologies for this kind of question as I’d rather have a more topic related comment here.
Thank you, Joshua, for your great feedback and the reference!
You need R 4.1.0 or higher to run the code. I should have added that as a comment (and now I did!).
|>is the new native pipe operator which transfers the result of an operation (mergein this case) into another function (herena.omit).Hope this helps!
nice way to analyze such a hypothesis!
but i think it is misleading to make only a cross-section analysis. if for instance one take all possible years for each country and make a country-wise analysis over time to correlate both values in a simple regression, one would find out that roughly half of the countries are increasing in political stability with the proportion of young people. explanatory power of the models is very diverse for each country. and i would also not conclude any causation out if this… but it shows that the picture is likely different between the countries. and of course, there are likely omitted variables that explains political stability.