
 In this post, we are going to replicate an analysis from the current issue of Scientific American about a common mathematical pitfall of Coronavirus antibody tests with R.
Many people think that when they get a positive result of such a test they are immune to the virus with high probability. If you want to find out why nothing could be further from the truth, read on!
The following article provides a good intuition of why the accuracy of screening tests is highly dependent on the infection rate: Scientific American: Coronavirus Antibody Tests Have a Mathematical Pitfall. They write:
A mathematical wrinkle makes these tests—and in fact, all screening tests—hard to interpret: even with a very accurate test, the fewer people in a population who have a condition, the more likely it is that an individual’s positive result is wrong. If it is, people might think they have the antibodies (and thus may have immunity), when in fact they do not.
We covered this concept in another post already (see Base Rate Fallacy – or why No One is justified to believe that Jesus rose) but because of the importance of the topic let us replicate their analysis with personograph plots (also called Kuiper-Marshall plots) which are an excellent way to communicate risks (see also Lying with Statistics: One Beer a Day will Kill you!).
Let us first repeat the definitions of sensitivity and specificity (we covered those here already: Learning Data Science: Understanding ROC Curves):
- Sensitivity or True Positive Rate (TPR): the proportion of actual (= true) positives (TP) that are correctly identified as such (e.g. the percentage of sick people who are correctly identified as having (had) the condition).
- Specificity or True Negative Rate (TNR): the proportion of actual (= true) negatives (TN) that are correctly identified as such (e.g. the percentage of healthy people who are correctly identified as not having (had) the condition).
That might be quite interesting but what really counts in the end aren’t any test results but whether you actually have (had) the virus or not! Those are two different things and therefore we define two additional measures:
- Positive predictive value (PPV): the probability that subjects with a positive screening test truly have (had) the disease.
- Negative predictive value (NPV): the probability that subjects with a negative screening test truly don’t have (have not had) the disease.
Please note that all four figures are conditional probabilities, but are going in different directions. For example, TPR gives the probability of a positive test result given you are sick, while PPV gives the probability of you being sick given a positive test result. We will see that both numbers can (and actually do!) diverge quite considerably.
Now we have everything in place to replicate the analysis with R (the personograph package can be found on CRAN). First with an infection rate of 5% (which is in the ballpark of the likely infection rate for most countries at the moment):
library(personograph)
## Loading required package: grImport
## Loading required package: grid
## Loading required package: XML
colorlist <- list(FN = "darkred", TP = "red", FP = "darkgreen", TN = "green")

TPR <- 0.95 # true positive rate = sensitivity
TNR <- 0.95 # true negative rate = specificity

IR <- 0.05 # infection rate
data <- list(FN = (1-TPR)*IR, TP = TPR*IR, FP = (1-TNR)*(1-IR), TN = TNR*(1-IR))
NPV <- round(100 * data$TN / (data$TN + data$FN), 1) # negative predictive value
PPV <- round(100 * data$TP / (data$TP + data$FP), 1) # positive predictive value
personograph(data, colors = colorlist, fig.title = paste0("PPV = ", PPV, "%, NPV = ", NPV, "%"), n.icons = 500, dimensions = c(20, 25))
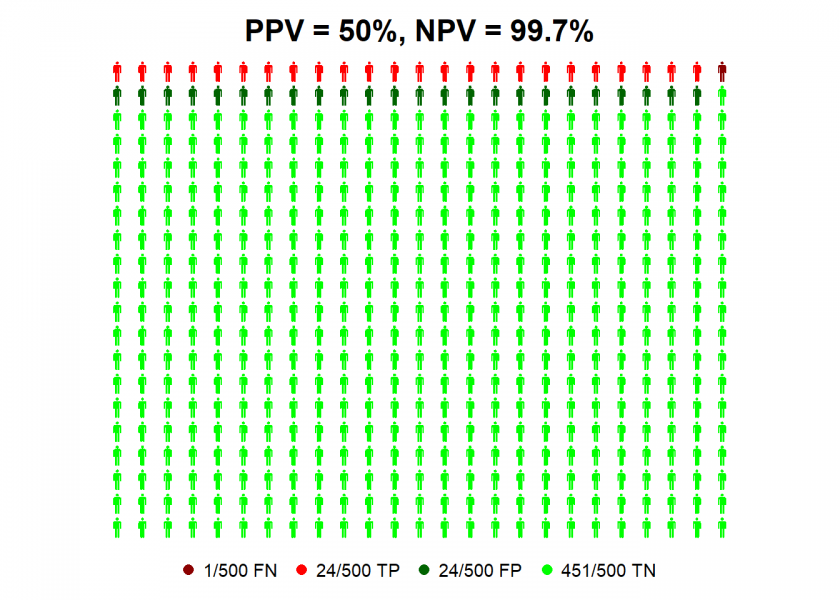
So we can see that even with antibody tests with high values for sensitivity and specificity a positive test result is not better than the toss of a coin, given the current infection rate! Why? Because for every true positive case (TP, in red) there is a false positive one (FP, in dark green).
The situation gets a better with an infection rate of 25%…
IR <- 0.25 # infection rate
data <- list(FN = (1-TPR)*IR, TP = TPR*IR, FP = (1-TNR)*(1-IR), TN = TNR*(1-IR))
NPV <- round(100 * data$TN / (data$TN + data$FN), 1) # negative predictive value
PPV <- round(100 * data$TP / (data$TP + data$FP), 1) # positive predictive value
personograph(data, colors = colorlist, fig.title = paste0("PPV = ", PPV, "%, NPV = ", NPV, "%"), n.icons = 500, dimensions = c(20, 25))
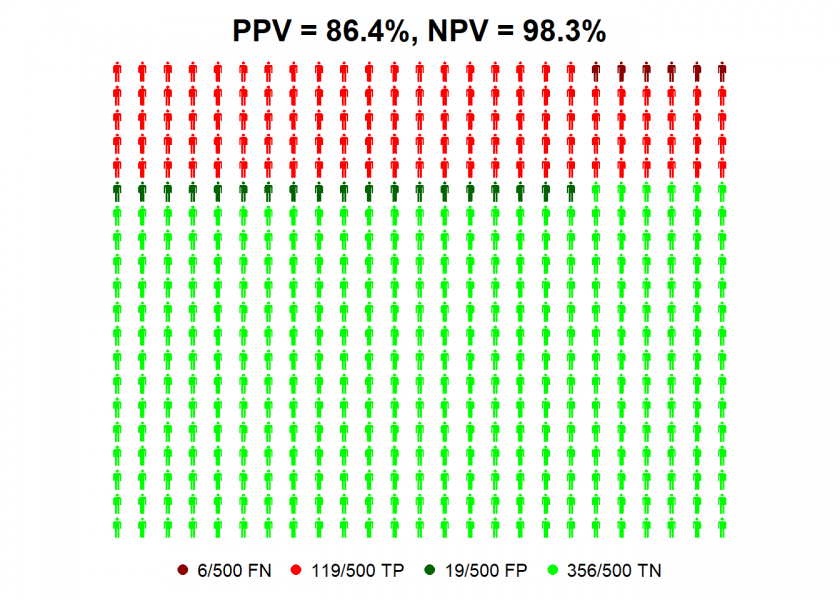
…where you can be nearly 90% confident that a positive test result means that you have (had) the virus! All of this shows the massive impact infection rates can have on the predictive value of these tests for individuals.
If you still doubt this I give you another intuition: the less probable it is that you have (had) the virus (which is the case right now because of the low infection rate) the more evidence you will need to prove the contrary, either by better tests (which we either don’t have at the moment or which are prioritized for the sickest patients) or by additional tests (which are scarcely done because of still limited resources).
On the other hand, if you get a negative result you can be pretty sure that you indeed have not had the virus!
Did you consider that the assay was validated using “True positives”, thus a sample that would represent a higher infection rate? If equal numbers positive controls and negative controls were used in the validation, thus a simulated 50% infection rate, the NPV and PPV calculate to both be 95% using your formulas.
To be honest with you I don’t understand what you are getting at… could you please elaborate?
Method validation is the process of determining if the method is fit for its intended purpose. In this case, the method is for detecting COVID anti-bodies at or above a concentration threshold. For these types of tests, there are two potential outcomes, present or absent, so the method is challenged by analyzing true positives and true negatives. The results of analyzing true positives during validation must result in 95% probability of detection to state the the true positive probability meets that criterion. The same is true for validating the true negative probability. It would be interesting to examine the validation data generated by the kit manufacturers.
I fully agree that screening methods are developed to minimize false negatives at the risk of having false positives, with any positives confirmed by other orthogonal tests/examinations.
Yes, this makes sense… thank you for commenting!
https://jamanetwork.com/journals/jama/fullarticle/2764954
This article describes some of the issues. Of note, “Although commercial manufacturers claim their tests have high sensitivity and specificity, they haven’t published their data yet. This lack of transparency is worrisome, Theel said: “The question is, when following symptom onset were these samples collected to show that sensitivity and specificity?”
Her laboratory has found that most people with SARS-CoV-2 don’t start producing antibodies—or seroconvert—until at least 11 to 12 days after symptom onset. “So, if we were using these rapid lateral flow assays at the point of care to test recently symptomatic patients,…they are more likely than not going to be negative,” she said.”
Another thing that is hastily cobbled together during this crisis, a crisis really on so many levels!
Could you explain how did u get to this?
FN = (1-TPR)*IRIs it applying bayes theorem?, …, I didn’t follow, sorry
No, sick people are divided into “true positives” and “false negatives”. To get the number of false negatives you just multiply by one minus the true positive rate (= false negative rate) and multiply this by the infection rate (= rate of sick people).
Does that make it clear?
yeah, thx
Another question:
using the infection rate implicitly assumes the test is applied to individuals randomly sampled from the whole population?, am I right?
If, for example, the test would be applied to those that select themselves for the test (presumably because they had mild symptoms), the calculations as shown in the post would not apply anymore, right?, .., in that case you would have an overall probability of have being infected and a lower probability of false positives?
The infection rate is the presumed true infection rate in this scenario, not an inferred one.
Yes, your scenario is basically my second example. Compared to the overall population it is biased towards a higher infection rate.