

One of the big sensations of the UEFA Euro 2020 is that Switzerland kicked out world champion France. We take this as an opportunity to share with you a simple statistical model to predict football (soccer) results with R, so read on!
Football is a highly stochastic game, which is one of the reasons for its appeal: anything can happen! But there are still some known patterns that can be used to build a predictive model.
First, it is well known that the probability for the number of goals in a game can be well approximated by a Poisson distribution.
Second, it is also well known that one of the best predictors of the strength of a team is its market value (in German there is the saying “Geld schießt Tore”, which translates to “money scores goals”). We can find the market value of the different teams e.g. here: transfermarkt.de.
The third ingredient that we need is the average number of goals scored per game. Wikipedia tells us that this is about 2.8 for the current tournament.
The main idea is to divide this average number according to the market values of both teams to get the average number of goals per team and feed that into two Poisson distributions to determine the probabilities for each potential number of goals scored:
mean_total_score <-  2.8 # https://en.wikipedia.org/wiki/UEFA_Euro_2020_statistics

# https://www.transfermarkt.de/europameisterschaft-2020/teilnehmer/pokalwettbewerb/EM20
country1 = "Switzerland"; colour1 <- "red"    ; value1 <- 0.29
country2 = "Spain"      ; colour2 <- "orange" ; value2 <- 0.92

ratio <- value1 / (value1 + value2)
mean_goals1 <- ratio * mean_total_score
mean_goals2 <- (1 - ratio) * mean_total_score

prob_goals1 <- dpois(0:7, mean_goals1)
prob_goals2 <- dpois(0:7, mean_goals2)

parbkp <- par(mfrow=c(1, 2))
max_ylim <- max(prob_goals1, prob_goals2)
plot(0:7, prob_goals1, type = "h", ylim = c(0, max_ylim), xlab = country1, ylab = "Probability", col = colour1, lwd = 10)
plot(0:7, prob_goals2, type = "h", ylim = c(0, max_ylim), xlab = country2, ylab = "", col = colour2, lwd = 10)
title(paste0(country1, " ", which.max(prob_goals1) - 1, ":", which.max(prob_goals2) - 1, " ", country2), line = -2, outer = TRUE)
par(parbkp)
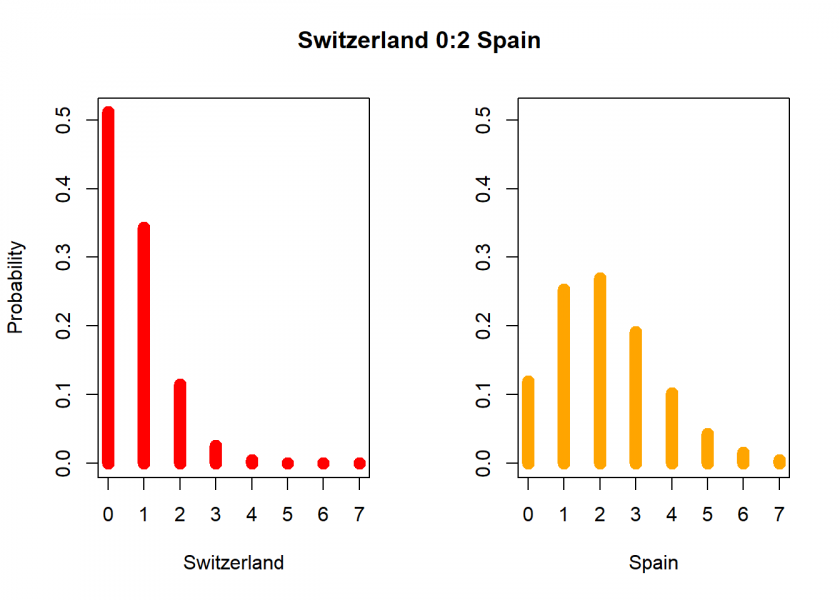
So the most probable prediction is that Spain will win this one clearly… but you never know! And apart from those hard numbers, many will root for the underdog anyway (me too because I have a special relationship with Switzerland since I did my Ph.D. there at the University of St. Gallen and still have a lot of friends from that time).
I have played around with this simple model for nearly ten years now and it often proved surprisingly accurate. Its biggest shortcoming is of course that it treats both distributions independently. Another one is that it doesn’t include the home advantage (although this effect seems to be fading). A third point is that it is based on only one variable (market value), but there are of course others that are also important (e.g. the ratio of goal shots of both teams or the World Football ELO Ratings).
Any ideas on how to improve the above model are highly welcome, please share them in the comments below.
DISCLAIMER
This post is written on an “as is” basis for educational purposes only and comes without any warranty. The findings and interpretations are exclusively those of the author and are not endorsed by or affiliated with any third party.
In particular, this post provides no sports betting advice! No responsibility is taken whatsoever if you lose money.
(If you make any money though I would be happy if you would buy me a coffee… that is not too much to ask, is it? 😉 )
UPDATE July 2, 2021
Unfortunately for Switzerland, our prediction got it (nearly) right. Spain won by a two-goal difference. The end result was 1:3 (after penalty shoot-out), instead of the predicted 0:2.
UPDATE July 3, 2021
A (slightly) better method would be not to take the total market value of the whole team but the average value per player (same source). In this case, the prediction would have been the same but in other cases, it could be different.
UPDATE July 12, 2021
The result of the final (before the following penalty shoot-out) would have been correctly predicted as Italy 1:1 England! Penalty shoot-outs are really only better coin tosses, the only thing one might conclude is that the stronger (= more expensive) team should have some edge. In this case that would have been England. But as we all know things turned out differently and Italy is the new European champion – Congratulations!
UPDATE August 25, 2021
I further improved the tool and adapted it for the German Bundesliga:
New Bundesliga Forecasting Tool: Can Underdog Hertha Berlin beat Bayern Munich?
Hi, great post.
To improve the model, I’d try to value the offensive pack and defensive pack of a team (as the sum of player values for each part). Then, based on the value of defense for A and attack of B, I’d calibrate the distribution of goals for B, and with A attack and B defense the probability of a goal from A. In the best of all worlds, I’d estimate the probability of scoring a goal from observations of matches. That could allow for some controls (home biais, importance of the match (qualification, final phase, demonstration)) and so on.
Interesting, thank you, Xavier!
Would be great if you could give some concrete examples of how you would proceed.
No way to suggest an improvement. Often similar questions are approached with logistic regression. A comparison might be interesting especially if we are teaching predictive modeling. Leading students into binary classification can be difficult. Thank you for the article.
Thank you for your feedback and your input, Matthew!