

Predicting football (a.k.a. soccer) games based on statistical models has been one of my hobbies for many years now.
Here, I will give you my prediction for Germany in the group stage of the World Cup 2022 with full R-code, so read on!
You can also watch the video for this post (in German):
The basis of our forecasting tool was explained in this blog post: Euro 2020: Will Switzerland kick out Spain too?. Basically, it takes the average number of goals of a typical game and divides them between the teams based on the relative strength, i.e. the average value of the players.
For this post, we adapted the parameters for the World Cup 2022 (the sources are given in the code below) to forecast the performance of Germany in the group stage. The tool can also easily be adapted to other football leagues, e.g. the English Premier League.
This is our forecasting function:
# https://www.heise.de/tp/features/Tore-und-das-Gesetz-der-kleinen-Zahlen-3365592.html
football_prediction <- function(team1, colour1, value1, team2, colour2, value2, mean_total_score = 3, home_advantage = 0.4) {
ratio <- value1 / (value1 + value2)
mean_goals1 <- ratio * mean_total_score + home_advantage/2
mean_goals2 <- (1 - ratio) * mean_total_score - home_advantage/2
goals <- 0:10
prob_goals1 <- dpois(goals, mean_goals1)
prob_goals2 <- dpois(goals, mean_goals2)
probs <- (prob_goals1 %o% prob_goals2) * 100 # outer product
colnames(probs) <- rownames(probs) <- goals
names(dimnames(probs)) <- c(team1, team2)
prob_team1_win <- probs[lower.tri(probs)] |> sum() |> round(1)
prob_draw <- diag(probs) |> sum() |> round(1)
prob_team2_win <- probs[upper.tri(probs)] |> sum() |> round(1)
parbkp <- par(mfrow = c(1, 2))
max_ylim <- max(prob_goals1, prob_goals2)
plot(goals[1:8], prob_goals1[1:8], type = "h", ylim = c(0, max_ylim), xlab = team1, ylab = "Probability", col = colour1, lwd = 10)
plot(goals[1:8], prob_goals2[1:8], type = "h", ylim = c(0, max_ylim), xlab = team2, ylab = "", col = colour2, lwd = 10)
title(paste(team1, paste(goals[which(probs == max(probs), arr.ind = TRUE)], collapse = ":"), team2), line = -2, outer = TRUE)
par(parbkp)
print(probs[1:8, 1:8] |> round(1))
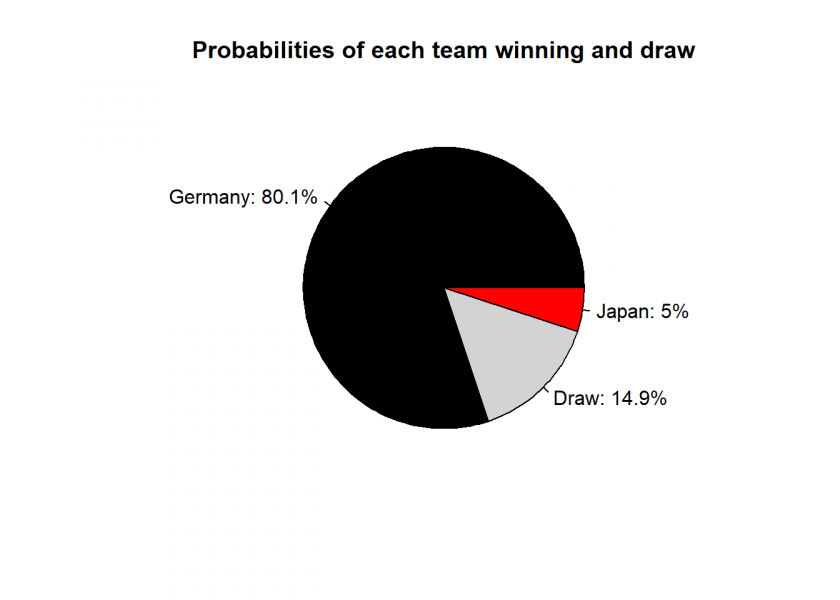
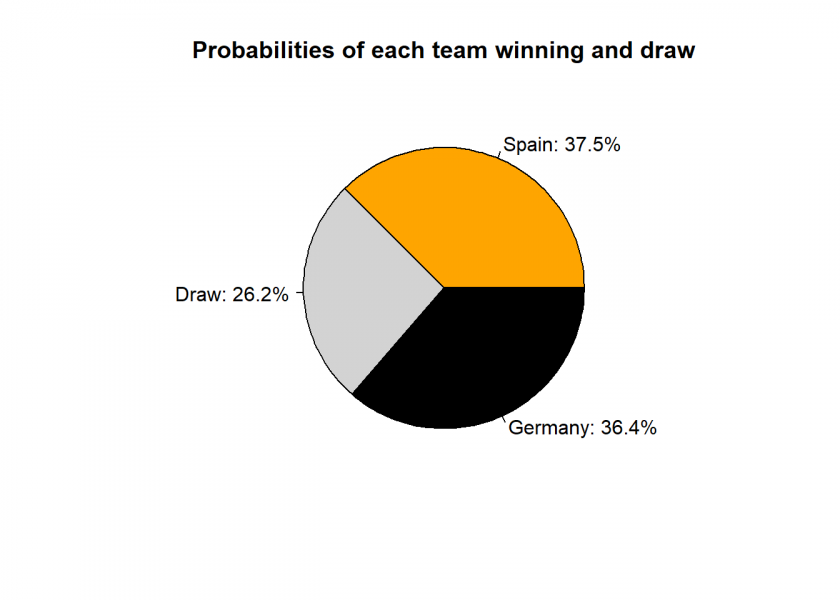
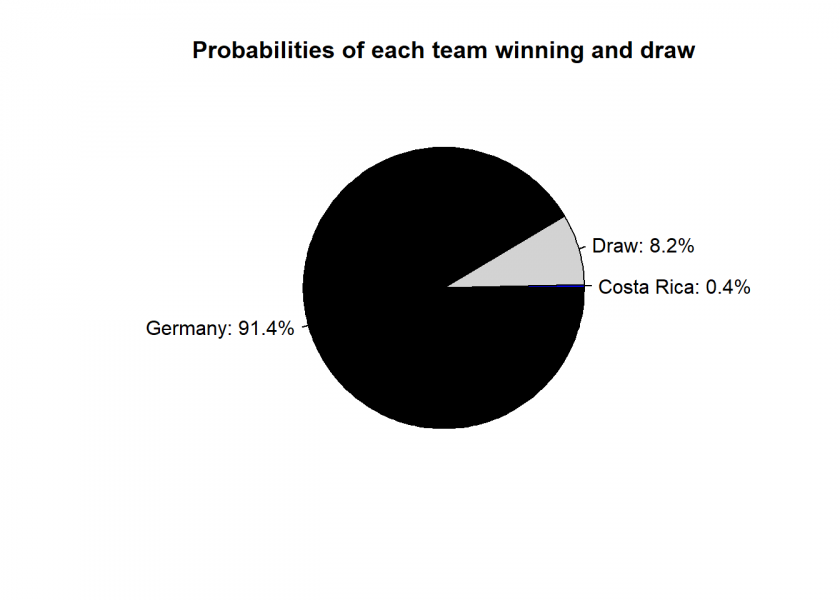
pie(c(prob_team1_win, prob_draw, prob_team2_win), labels = c(paste0(team1, ": ", prob_team1_win, "%"), paste0("Draw: ", prob_draw, "%"), paste0(team2, ": ", prob_team2_win, "%")), col = c(colour1, "lightgrey", colour2), main = "Probabilities of each team winning and draw")
}
The first game is Germany vs. Japan:
# https://de.statista.com/statistik/daten/studie/160824/umfrage/tore-pro-spiel-bei-fussball-wm-seit-1930/
# https://www.transfermarkt.de/weltmeisterschaft-2022/teilnehmer/pokalwettbewerb/WM22
football_prediction(team1 <- "Germany", colour1 <- "black", value1 <- 34.06,
                    team2 <- "Japan", colour2 <- "red", value2 <- 5.87,
                    mean_total_score <- 2.64, home_advantage = 0)
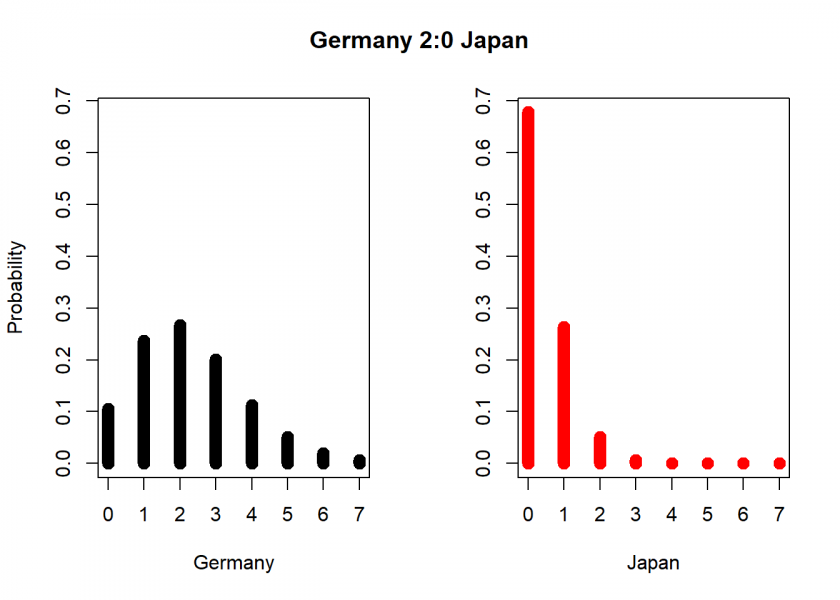
##        Japan
## Germany    0   1   2   3 4 5 6 7
##       0  7.1 2.8 0.5 0.1 0 0 0 0
##       1 16.1 6.2 1.2 0.2 0 0 0 0
##       2 18.1 7.0 1.4 0.2 0 0 0 0
##       3 13.6 5.3 1.0 0.1 0 0 0 0
##       4  7.6 3.0 0.6 0.1 0 0 0 0
##       5  3.4 1.3 0.3 0.0 0 0 0 0
##       6  1.3 0.5 0.1 0.0 0 0 0 0
##       7  0.4 0.2 0.0 0.0 0 0 0 0
Then comes Spain vs. Germany:
football_prediction(team1 <- "Spain", colour1 <- "orange", value1 <- 32.44,
                    team2 <- "Germany", colour2 <- "black", value2 <- 34.06,
                    mean_total_score <- 2.64, home_advantage = 0)
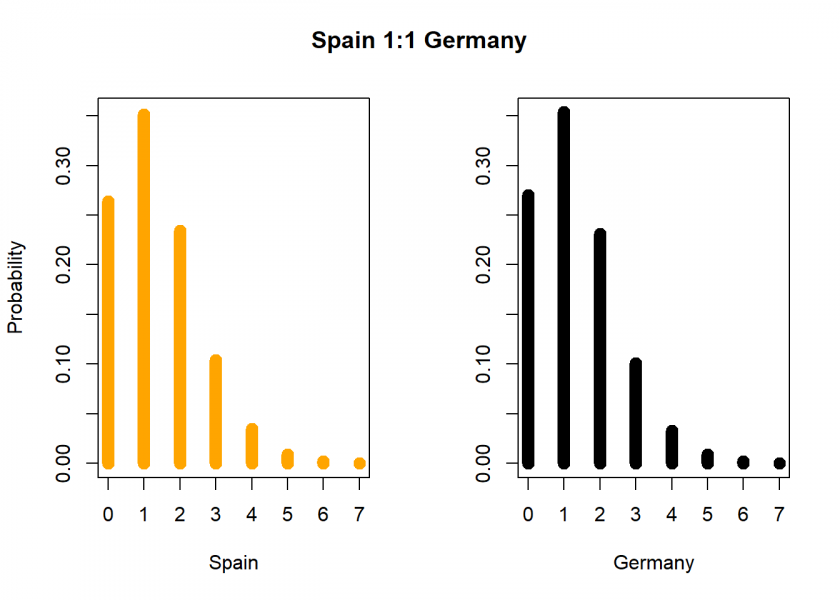
##      Germany
## Spain   0    1   2   3   4   5   6 7
##     0 7.1  9.6 6.5 2.9 1.0 0.3 0.1 0
##     1 9.2 12.4 8.4 3.8 1.3 0.3 0.1 0
##     2 5.9  8.0 5.4 2.4 0.8 0.2 0.1 0
##     3 2.5  3.4 2.3 1.0 0.4 0.1 0.0 0
##     4 0.8  1.1 0.7 0.3 0.1 0.0 0.0 0
##     5 0.2  0.3 0.2 0.1 0.0 0.0 0.0 0
##     6 0.0  0.1 0.0 0.0 0.0 0.0 0.0 0
##     7 0.0  0.0 0.0 0.0 0.0 0.0 0.0 0
And last is Costa Rica vs. Germany:
football_prediction(team1 <- "Costa Rica", colour1 <- "blue", value1 <- 0.705,
                    team2 <- "Germany", colour2 <- "black", value2 <- 34.06,
                    mean_total_score <- 2.64, home_advantage = 0)
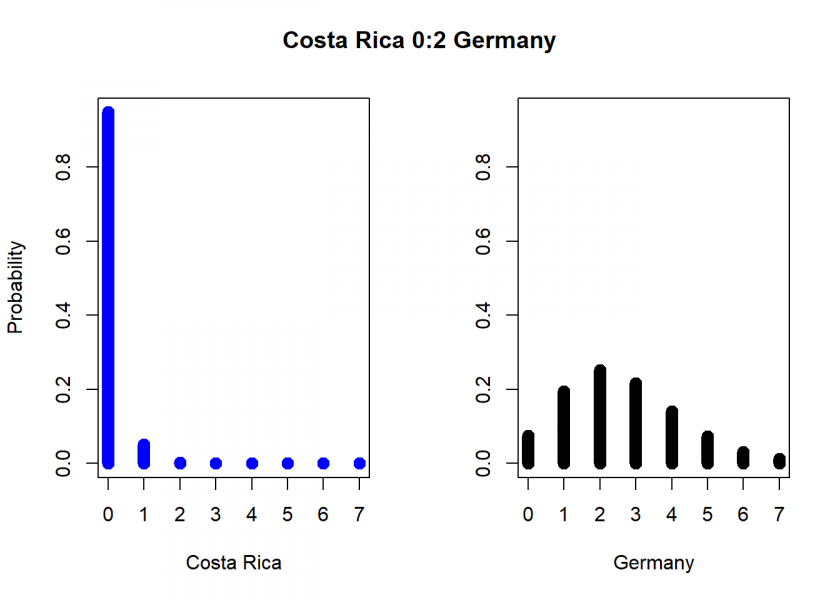
##           Germany
## Costa Rica   0    1    2    3    4   5   6   7
##          0 7.1 18.5 23.9 20.6 13.3 6.9 3.0 1.1
##          1 0.4  1.0  1.3  1.1  0.7 0.4 0.2 0.1
##          2 0.0  0.0  0.0  0.0  0.0 0.0 0.0 0.0
##          3 0.0  0.0  0.0  0.0  0.0 0.0 0.0 0.0
##          4 0.0  0.0  0.0  0.0  0.0 0.0 0.0 0.0
##          5 0.0  0.0  0.0  0.0  0.0 0.0 0.0 0.0
##          6 0.0  0.0  0.0  0.0  0.0 0.0 0.0 0.0
##          7 0.0  0.0  0.0  0.0  0.0 0.0 0.0 0.0
What do you think about these predictions? What are your predictions? Please write it in the comments!
DISCLAIMER
This post is written on an “as is” basis for educational purposes only and comes without any warranty. The findings and interpretations are exclusively those of the author and are not endorsed by or affiliated with any third party.
In particular, this post provides no sports betting advice! No responsibility is taken whatsoever if you lose money.
(If you make any money though I would be happy if you would buy me a coffee… that is not too much to ask, is it? 😉 )