

My father-in-law used to write down the numbers drawn on the lottery to find patterns, especially whether some numbers were “due” because they hadn’t been drawn for a long time. He is not alone! And don’t they have a point? Shouldn’t the numbers balance after some time? Read on to find out!
The perceived paradox arises because long streaks of supposedly random events (like getting red in roulette) are extremely unlikely yet that doesn’t change the probability of the next draw. To think differently is known as the so-called gambler’s fallacy (a.k.a. Monte Carlo fallacy). Casinos even fuel this fallacy proactively by showing such statistics to draw players into their games (with so-called hot and cool numbers):

The longest streak in roulette purportedly happened in 1943 in the US when the colour red won 32 consecutive times in a row! A quick calculation shows that the probability of this happening seems to be beyond crazy:
0.5^32
[1] 2.328306e-10
So, what is going on here? For once streaks and clustering happen quite naturally in random sequences: if you got something like “red, black, red, black, red, black” and so on I would worry if there was any randomness involved at all (read more about this here: Learning Statistics: Randomness is a strange beast). The point is that any sequence that is defined beforehand is as probable as any other (see also my post last week: The Solution to my Viral Coin Tossing Poll). Yet streaks catch our eye, they stick out.
But there is more. Intuitively we know that “in the long run” probabilities stabilize. Basically, this is the whole idea of probabilities in the first place. On the other hand, it seems plausible that coins, dice and roulette wheels have no memory, so they cannot know how many times they showed one outcome or the other in a row. How do those two things go together?
To clarify we toss a virtual coin 50,000 times and plot the relative deviation from the expected value of 50% per side:
set.seed(4711)
n <- 50000
x <- sample(0:1, n, replace = TRUE)
s <- cumsum(x)
r <- s / (1:n) # relative deviation from expected value
t <- s - (1:n) / 2
plot(r, ylim = c(0.4, 0.6), type = "l", main = "Relative Deviation from Expected Value")
abline(h = 0.5)
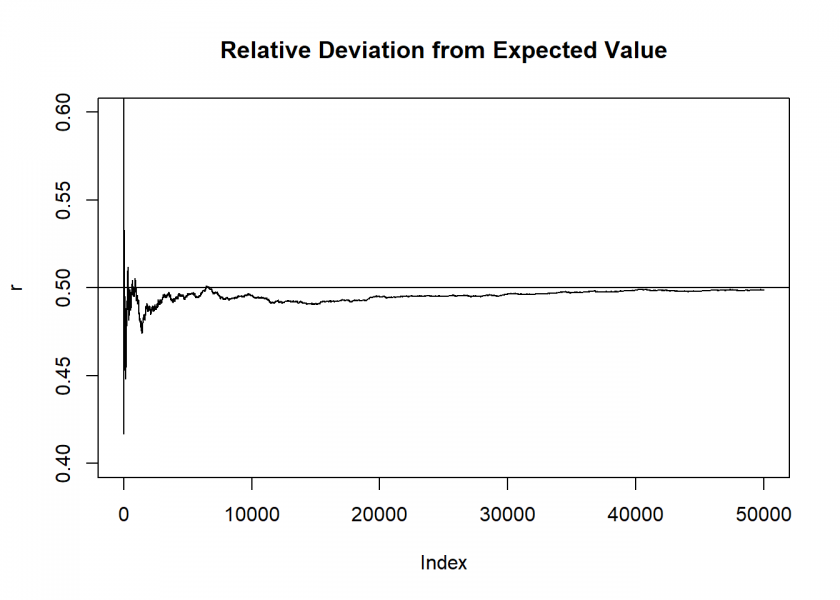
We see that the relative deviation closes in on the fifty-fifty line. This is called law of large numbers. One version goes:
The relative frequency stabilizes around the theoretical probability with frequently repeated random trials.
The point is that this stabilizing doesn’t occur because the probability of getting “the other” outcome increases… but indeed because it stays the same, at fifty-fifty in this case: the imbalance from the beginning just fades out!
This doesn’t say anything about the absolute deviations (which are the one we are betting on!):
plot(t, type = "l", main = "Absolute Deviation from Expected Value")
abline(h = 0)
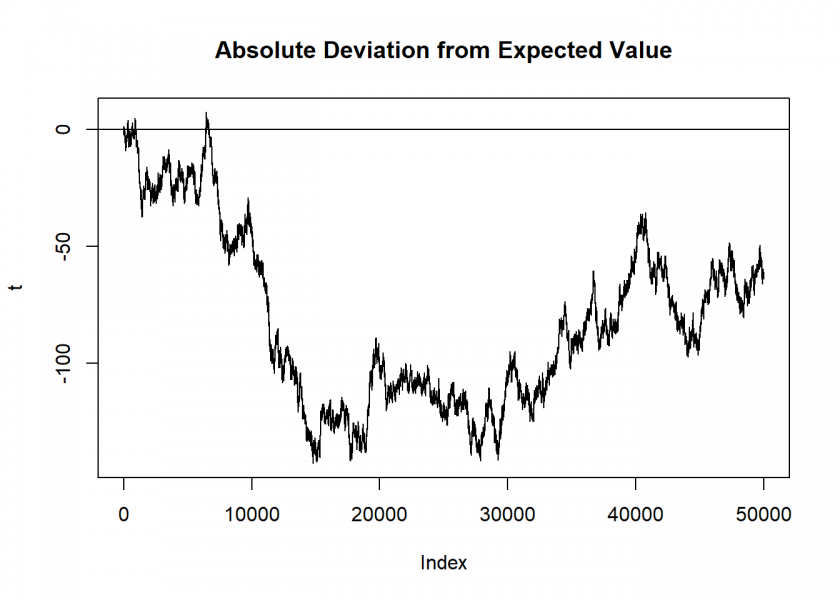
There are large swings with no clear tendency… and there are no “hot” nor “cool” numbers!
So in order to solve the perceived paradox we can now understand that many people confuse relative and absolute deviations! Relative deviations tend to become smaller, whereas absolute deviations don’t. The intuition that a number is “due” refers to relative deviations whereas we can only bet on absolute outcomes… and there the probability stays the same, independent of what came before!
We again end this post with a comic that gives some humorous variant of the same idea (this time from Abstruse Goose):
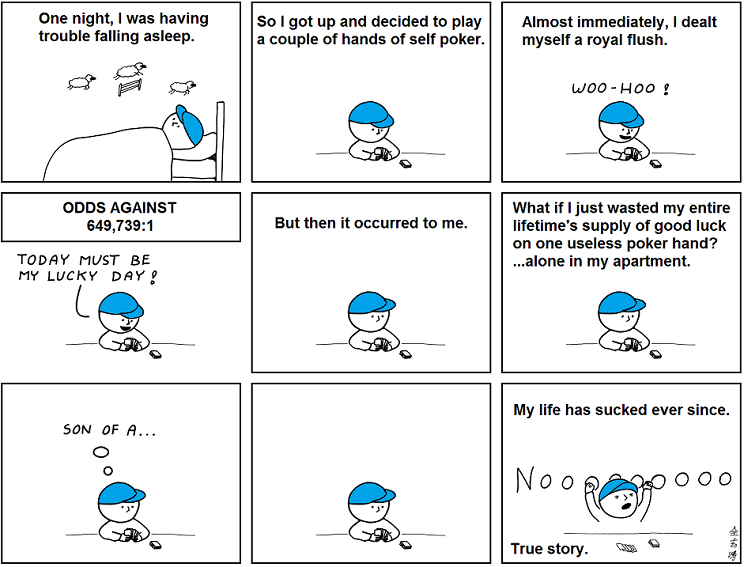
(as a bonus I will even give away an easter egg here: the original filename is just_kidding_it_actually_sucked_long_before_that.png)
“On the other hand….”
Your column is exactly correct so long as the coin, or cards, or roulette wheel, is honest in the mathematical sense.
Counterexample: Many years ago, my brother hung out for a while next to a booth (part of a travelling carnival) with a “wheel of fortune” setup. He noticed that, due to friction or balance problems, a couple numbers won far more than true random would predict. He bet those numbers and cleaned up.
So, if a pair of dice roll a seven, 10 times in a row, it might be statistics. Or it might be loaded dice.
Thank you, Carl, spot on, as always.
In reality, you could go as far as saying that you bet on the numbers that came up more often in the past because either they are just random or the instrument is biased, in which case you have an edge (which could be exploited by Kelly betting, or Half-Kelly for the cautious).
Hello Holger,
thanks for the refresher, good read.
Kind regards,
Thomas
Dear Thomas,
Thank you very much for your feedback, I really appreciate it.
best
h