
 Do you cheat on your partner? Do you take drugs? Are you gay? Are you an atheist? Did you have an abortion? Will you vote for the right-wing candidate? Not all people feel comfortable answering those kinds of questions in every situation honestly.
So, is there a method to find the respective proportion of people without putting them on the spot? Actually, there is! If you want to learn about randomized response (and how to create flowcharts in R along the way) read on!
The question is how can you get a truthful result overall without being able to attribute a certain answer to any single individual. As it turns out, there is a very elegant and ingenious method, called randomized response. The big idea is to, as the name suggests, add noise to every answer without compromising the overall proportion too much, i.e. add noise to every answer so that it cancels out overall!
Big tech companies like Google and Microsoft also use this method to e.g. collect telemetry data in a privacy-preserving manner. The broader concept is called differential privacy, which is differentiated into local and global methods. Global methods are being used when the data is already collected, local methods concern the process of data collection itself. We will be focusing on the latter here.
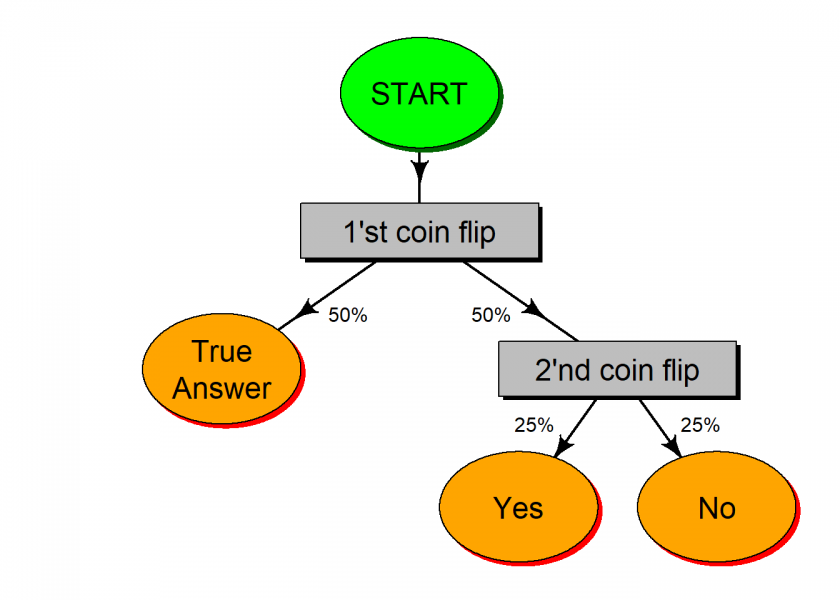
One way to do randomized response is the following: each participant is asked to flip two coins. If the first coin comes up heads, she answers the question truthfully. Otherwise, she answers “yes” if the second coin came up heads and “no” if it came up tails. This way nobody can find out whether the participant answered truthfully or not, her answers could have been produced by randomness. Yet, the great thing is that when asking a whole group of people it is possible to calculate the true proportions because the added random noise cancels out… we will see how later in the post.
The process is being depicted in the following flowchart, created with R and the diagram package (on CRAN):
library(diagram)
## Loading required package: shape
oldpar <- par(mar = c(1, 1, 1, 1))
openplotmat()
elpos <- coordinates (c(1, 1, 2, 4))
fromto <- matrix(ncol = 2, byrow = TRUE, data = c(1, 2, 2, 3, 2, 4, 4, 7, 4, 8))
nr <- nrow(fromto)
arrpos <- matrix(ncol = 2, nrow = nr)
for (i in 1:nr)
  arrpos[i, ] <- straightarrow(to = elpos[fromto[i, 2], ], from = elpos[fromto[i, 1], ]
                              , lwd = 2, arr.pos = 0.6, arr.length = 0.5)
textellipse(elpos[1, ], 0.1, lab = "START", box.col = "green", shadow.col = "darkgreen", shadow.size = 0.005, cex = 1.5)
textrect   (elpos[2, ], 0.15, 0.05, lab = "1'st coin flip", box.col = "grey", shadow.col = "black", shadow.size = 0.005, cex = 1.5)
textrect   (elpos[4, ], 0.15, 0.05, lab = "2'nd coin flip", box.col = "grey", shadow.col = "black", shadow.size = 0.005, cex = 1.5)
textellipse(elpos[3, ], 0.1, 0.1, lab = c("True", "Answer"), box.col = "orange", shadow.col = "red", shadow.size = 0.005, cex = 1.5)
textellipse(elpos[7, ], 0.1, 0.1, lab = c("Yes"), box.col = "orange", shadow.col = "red", shadow.size = 0.005, cex = 1.5)
textellipse(elpos[8, ], 0.1, 0.1, lab = c("No"), box.col = "orange", shadow.col = "red", shadow.size = 0.005, cex = 1.5)

dd <- c(0.0, 0.025)
text(arrpos[2, 1]+0.06, arrpos[2, 2], "50%")
text(arrpos[3, 1]-0.06, arrpos[3, 2], "50%")
text(arrpos[4, 1]-0.03, arrpos[4, 2]+0.05, "25%")
text(arrpos[5, 1]+0.03, arrpos[5, 2]+0.05, "25%")
par(oldpar)
Of course, this is just one potential way of doing it and it doesn’t have to be real coin flips: the whole process could be done transparently in the background while collecting personal data automatically, yet to give you some feeling for the method let us actually do a toy example next.
We now simulate a survey of 200 people who get asked an embarrassing question, e.g. whether they are an alcoholic. In our sample, about 15% are alcoholics (which is about the real rate in Western countries, believe it or not!):
set.seed(123)
n <- 200
true_responses <- sample(c(TRUE, FALSE), size = n, replace = TRUE,  prob = c(0.15, 0.85)) # only responders know
table(true_responses) / n
## true_responses
## FALSE  TRUE
##  0.85  0.15
We now use the above method to get an estimate of the proportion without embarrassing single individuals:
randomized_response <- function(true_response)
  ifelse(sample(c(TRUE, FALSE), 1), true_response, sample(c(TRUE, FALSE), 1))
randomized_response <- Vectorize(randomized_response)

randomized_responses <- randomized_response(true_responses) # what comes out of survey
How can we actually get rid of the noise? Mathematician Dr. John D. Cook explains (source: Randomized response, privacy, and Bayes theorem):
How can [one] estimate p, the [true] proportion […]? Around half […] will get a head on the first coin and answer truthfully; the rest will look at the second coin and answer yes or no with equal probability. So the expected proportion of yes answers is Y = 0.5p + 0.25, and we can estimate p as 2Y – 0.5.
Let us actually do this for our little example:
2 * sum(randomized_responses) / n - 0.5
## [1] 0.14
With an estimate of 14% we are obviously not so far off from the true proportion (15%). To find out how many people answer truthfully, we do another quick calculation:
sum(true_responses == randomized_responses) / n
## [1] 0.75
This makes sense since 50% give the true answer anyway and 25% by chance, which makes 75% altogether.
Who would have thought that a little bit of randomness at the right place could reveal hidden truths people are normally ashamed of to admit?
One thought on “Local Differential Privacy: Getting Honest Answers on Embarrassing Questions”