

About two years ago the renowned medical journal “The Lancet” came out with the rather sensational conclusion that there is no safe level of alcohol consumption, so every little hurts! For example, drinking a bottle of beer per day (half a litre) would increase your risk of developing a serious health problem within one year by a whopping 7%! When I read that I had to calm my nerves by having a drink!
Ok, kidding aside: in this post, you will learn how to lie with statistics by deviously mixing up relative and absolute changes in risks, so read on!
The meta-study “Risk thresholds for alcohol consumption” adheres to the highest scientific standards, that is not the problem. The problem is how they chose to communicate the associated changes in risks for consuming alcohol.
For example, they tell you that by drinking a bottle of beer a day (half a litre) your risk of developing a serious health problem (like cardiovascular disease, cancer, cirrhosis of the liver, inflammation of the pancreas or diabetes) within one year would increase by 7%, i.e. 63 people on top of 914 people who would get a serious health problem anyway:
63 / 914 * 100 # shock horror: nearly 7% more with health problems when drinking half a litre of beer per day!
## [1] 6.892779
So, what does that mean? That about one in fourteen beer drinkers are going to bite the dust (no pun intended) next year? Fortunately not!
The problem is that this is a relative change in risk! It does not really help to assess the real danger. Only absolute changes in risk can do that!
To illustrate we use the personograph package (on CRAN) to show you what is really going on. Taking 2000 people about 18 would develop a serious health issue within one year anyway…
library(personograph)
## Loading required package: grImport
## Loading required package: grid
## Loading required package: XML

n <- 2000
probl_wo_alc <- 18 / n

data <- list(first = probl_wo_alc, second = 1-probl_wo_alc)
personograph(data,  colors = list(first = "black", second = "#efefef"),
             fig.title = "18 of 2000 people with health problems",
             draw.legend = FALSE, n.icons = n, dimensions = c(20, 100),
             plot.width = 0.97)
## Warning in grid.Call.graphics(C_text, as.graphicsAnnot(x$label), x$x,
## x$y, : font family not found in Windows font database

…by consuming about 20 grams of alcohol per day (i.e. about 25 mL) a little more than one person would become seriously sick on top of that:
probl_w_alc <- 1 / n

data_2 <- list(first = probl_wo_alc, second = probl_w_alc, third = 1-(probl_wo_alc+probl_w_alc))
personograph(data_2, colors = list(first = "black", second = "red", third = "#efefef"),
             fig.title = "About 1 additional case with half a litre of beer per day",
             draw.legend = FALSE, n.icons = n, dimensions = c(20, 100),
             plot.width = 0.97)
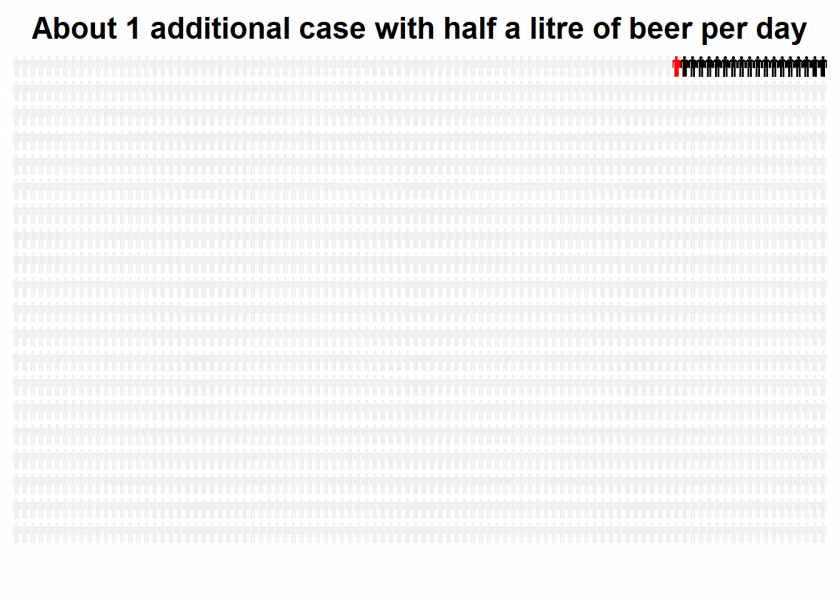
As you can see, this doesn’t look spectacular at all! Yet, this would have been a good way to communicate the results so that everybody could get a feeling for what they really mean (but as I said, this doesn’t look spectacular at all, go figure!).
Doing the numbers also gives an absolute change in risk by only 0.063%! It is about 50% more probable to die in a house fire (and how many people do you personally know who actually died in a house fire? I don’t know anybody…)!
63 / 100000 * 100 # only 0.063% in absolute numbers!
## [1] 0.063
So, basically, when you base your calculation of the additionally sick (= red) person on the persons that become sick anyway (= black), you are talking about relative change in risk. By attributing it to the whole population you are talking about absolute change in risk.
Please note: I do not say that it is safe to drink alcohol! But you have to put the numbers in perspective and the risk doesn’t seem to be overly high (to put it mildly) when you drink responsibly!
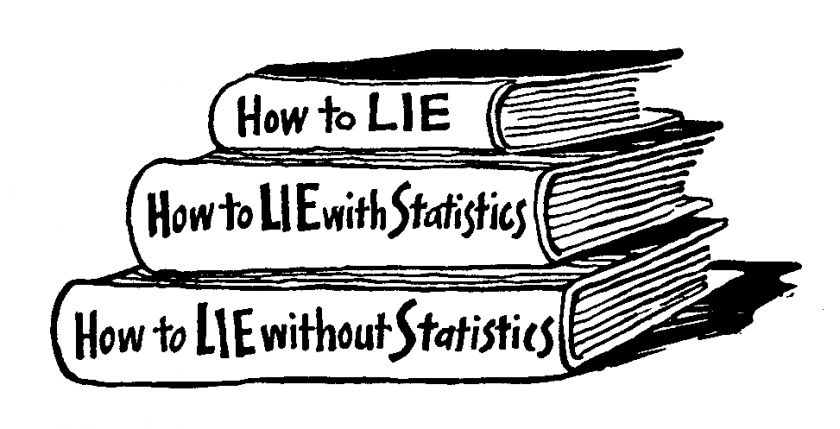
You see that you can use statistics not only to “lie” but to clarify things and communicate facts transparently. So, the problem lies not so much in statistics but in dishonesty and manipulation per se, which is the idea of one of my favorite cartoons (found here: CrossValidated):
UPDATE June 23, 2020
For another useful application of personograph plots see this post:
COVID-19: False Positive Alarm.
UPDATE October 21, 2022
I created a video for this post (in German):
Relative risk reporting is absolute standard in health-related research and epidemiology.
E.g. Smoking increases your life-time risk of lung cancer compared to a non-smoker by the factor 15 and not only by 5%.
Or: if you want to tell parents that the rationale for vaccination is to reduce the risk of a potentially deadly disease by 0.1% to 0, you will get a surprised reply even by parents who understand the need for vaccinations.
I think, as long as you are clearly formulating, reporting relative risks is far from “lying” with statistics.
The problem is that even many medical professionals don’t understand the numbers and their meaning: Do doctors understand test results?.
This is a well-known fact and if those are still being published in this form which makes them look more spectacular while the real effects are only minuscule so that you can sell more drugs and therapies or if only to boost your impact factor I would call it “lying”.
My colleague Professor Gigerenzer (Director of Max Planck Institute for Human Development and of Harding Center for Risk Literacy) has published a lot on this problem and its implications.
First of all, could it be that you linked to a different study? I could not find any of your numbers in the study you linked to. Second, “lying” is a strong word. In this regard, I think, I agree somewhat with the first comment.
From my experience, I can confirm that doctors have a hard time understanding “test results”, in my view, simply because they are not properly educated for that. I mean, interpreting studies is complicated and doctors will not spend even remotely enough time in their study to learn all the nuances.
So, although I strongly advocate clear and correct scientific communication, I don’t think changing numbers here and there from absolute to relative will solve the “understanding test results” problem in any way. The only sensible way for me is that study findings are explained to doctors by a statistician or epidemiologist, or ideally by a person, who is half a doctor and have a statistician. The latter, imo, would even warrant an own branch of study taught at university.
On a last note: given how much harm is caused by alcohol, to be honest, I wouldn’t even mind if they exaggerate their results, i.e., they might sort of doing the right thing for the wrong reason 😉
Thank you for your comment, Roman.
No, it is the right study but this was exactly the problem: the authors didn’t give those numbers, they were given later by the press department!
I agree that medical doctors don’t have enough statistical training… which is a shame since their subject is entirely based on statistical studies! Together with my colleagues, I designed a new course of study at our university: Medical Engineering and Data Science (MEDS). We started in German but it is conceivable to switch to English.
Never mind. I am from Germany too 🙂
I am not sure, there is enough time to cover both, statistics and the “medical stuff”. The study of medicine is overloaded anyway already (at least in Germany). Also in my experience (I used to teach medical students for years) there will probably just not enough students, who would pass a study of medicine with serious statistics content.
But the good news is, I also think, there is no need for this. At the end, it’s just a matter of specialization and to lay the ground for the specialist to communicate with each other, which is why I think, the ideal person is one that is half proficient in both areas. Your course might be a step in this direction.
Beste Gruesse aus Marburg
Very interesting, thank you for sharing your view on the matter… let us keep in touch, I sent you a LinkedIn invite ??
…btw I don’t believe in doing questionable deeds for supposedly well-intended causes. I believe in honesty.
Unfortunately, I think you missed the plot on this one. First, relative risk is the standard way to report the results of medical studies. So even if it’s wrong, it doesn’t constitute lying.
More importantly, the results presented in the study don’t support the conclusion that one beer a day is harmful. That result comes solely from the model the analysts chose, which is mainly determined by the health effects of people who drank more than one beer a day. The actual mean estimate of the health effect for one beer a day shows no increase in risk, compared to no drinks. If the analysts had instead fit a threshold model which allowed for the possibility of no risk at one drink, and increasing risk for more drinks, they probably would have reached a different conclusion.
So go ahead and have that drink.
Thank you Eric for your comment but I am afraid that you are the one who missed it.
No. 1: I know that presenting only relative risk is still done, yet it is not seen as good practice (see e.g. here: https://www.ncbi.nlm.nih.gov/pmc/articles/PMC2844943/) and normally high-quality, high-impact journals demand also absolute risks (why the Lancet didn’t do that in this case, remains a mystery… their press department provided this information only afterwards).
No. 2: You completely missed the irony of the headline. The post shows that the (absolute) risk is in fact negligible (as you say, so we actually agree here!).
cheers
h