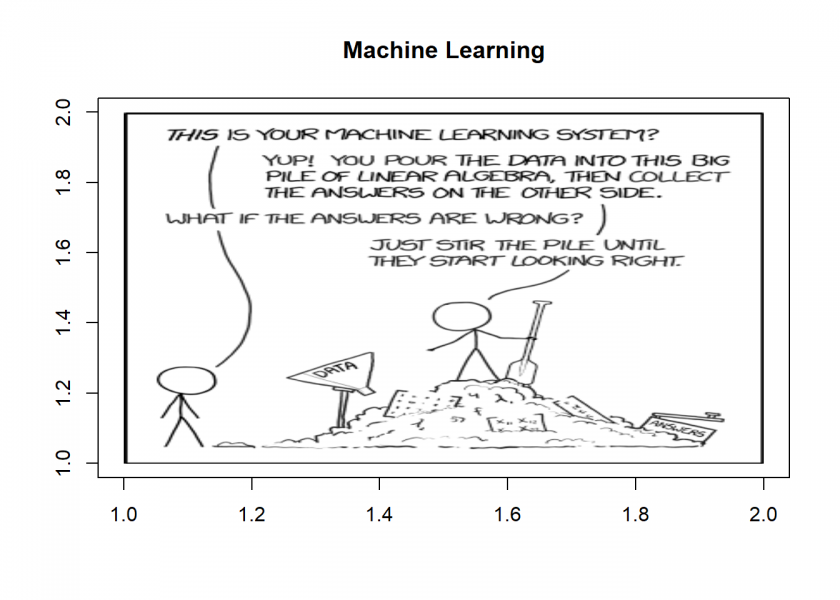
xkcd webcomics is one of the institutions of the internet, especially for the nerd community. If you want to learn how to fetch JSON data from a REST API, download a file from the internet and display a PNG file in a ultra-simple example, read on!
Many services on the internet provide a web service so that it is easier for machines to get access to their data. The access point is called an Application Programming Interface (API) and there are different types of APIs. One especially widespread type is known under the name REST (for REpresentational State Transfer) and a data format that is often used is called JSON (for JavaScript Object Notation). So this is what we will do first here: Fetching JSON data from a REST API!
As a simple example, we will use the JSON interface of xkcd webcomics, the documentation is very concise:
If you want to fetch comics and metadata automatically,
you can use the JSON interface. The URLs look like this:http://xkcd.com/info.0.json (current comic)
or:
http://xkcd.com/614/info.0.json (comic #614)
Those files contain, in a plaintext and easily-parsed format: comic titles,
URLs, post dates, transcripts (when available), and other metadata.
To access the data we will use the wonderful jsonlite package (on CRAN):
library(jsonlite)

# call api
xkcd <- fromJSON("http://xkcd.com/1838/info.0.json")
str(xkcd)
## List of 11
##  $ month     : chr "5"
##  $ num       : int 1838
##  $ link      : chr ""
##  $ year      : chr "2017"
##  $ news      : chr ""
##  $ safe_title: chr "Machine Learning"
##  $ transcript: chr ""
##  $ alt       : chr "The pile gets soaked with data and starts to get mushy over time, so it's technically recurrent."
##  $ img       : chr "https://imgs.xkcd.com/comics/machine_learning.png"
##  $ title     : chr "Machine Learning"
##  $ day       : chr "17"
It couldn’t be any easier, right!
To download the PNG image as a raw file we use download.file from Base R:
#download file
download.file(xkcd$img, destfile = "images/xkcd.png", mode = 'wb')
Finally, we want to plot the image, we use the png package (on CRAN) for that:
library(png)

# plot png
plot(1:2, type='n', main = xkcd$title, xlab = "", ylab = "")
rasterImage(readPNG("images/xkcd.png"), 1, 1, 2, 2)

If this doesn’t work on your system please consult the documentation, there might be system-related differences.
We can, of course, display the other data directly:
xkcd$alt
## [1] "The pile gets soaked with data and starts to get mushy over time, so it's technically recurrent."
This has hopefully given you some inspiration for your own experiments with more sophisticated APIs… if you have interesting examples and use cases please post them in the comments below!
UPDATE November 24, 2020
Jerry shared another, very elegant, method with us in the comments. It is based on the excellent magick package (on CRAN):
library(magick)
image_read(xkcd$img)


Instead of png/raster it is much easier to use the magick packge to read the image. The full code is this:
xkcd <- jsonlite::fromJSON("http://xkcd.com/1838/info.0.json") magick::image_read(xkcd$img)Thank you, jerry! That is very elegant, good stuff!
Updated the post accordingly, thank you again!