
 In From Coin Tosses to p-Hacking: Make Statistics Significant Again! I explained the general principles behind statistical testing, here I will give you a simple method that you could use for quick calculations to check whether something fishy is going on (i.e. a fast statistical BS detector), so read on!
We are living in a complex world and it is often not easy to distinguish “alternative facts” from the truth. In this post, I am giving you the statistical analog of a Swiss army knife that you could use with minimal effort to sort out false claims even on the back of an envelope (sometimes you might need a pocket calculator which should be no problem in the age of ubiquitous smartphones). The post is inspired by the excellent book “A Universal ‘Pocket’ Statistical Tool – Based on the Pearson Chi-Square Goodness of Fit Test” by Dr. Frederick Ruland.
The big idea behind the method is to find out whether something is actually the case due to some underlying effect – or just due to pure chance. Relevant questions like the following can be answered:
- Gambling: is that die fair or loaded?
- Business: is there an unusually large proportion of men in management positions?
- Politics: is there an unusually large proportion of Afro-Americans stopped and searched by police?
- Education: are there unusually large discrepancies in the scoring of essays between two teachers?
- Production: are the box weights unusually different from the target goal?
You may have noticed that the word “unusually” is used unusually often (no pun intended). With “unusual” we mean something happening with a probability of only 5% or less (for details again see From Coin Tosses to p-Hacking: Make Statistics Significant Again!).
To achieve this a very simple calculation is done:
- Square the difference of the observed value of one group with what would be the expected value of that group.
- Divide by the expected value of that group.
- Square the difference of the observed value of the other group with what would be the expected value of that group.
- Divide by the expected value of that group.
- Add both values.
- If the result is bigger than 3.84 the probability of the observed result happening just by chance is below 5% -> we are on to something!
In the mentioned blog post we had the example of a coin being tossed ten times and showing nine times heads (and only one time tails). Let us repeat the calculation here:
- Observed number of heads = 9
- Expected number of heads = 5
- Observed number of tails = 1
- Expected number of tails = 5
Let us use R as a calculator:
(((9 - 5)^2) / 5) + (((1 - 5)^2) / 5)
## [1] 6.4
Because the result 6.4 is bigger than 3.84 we can say that the coin is unfair!
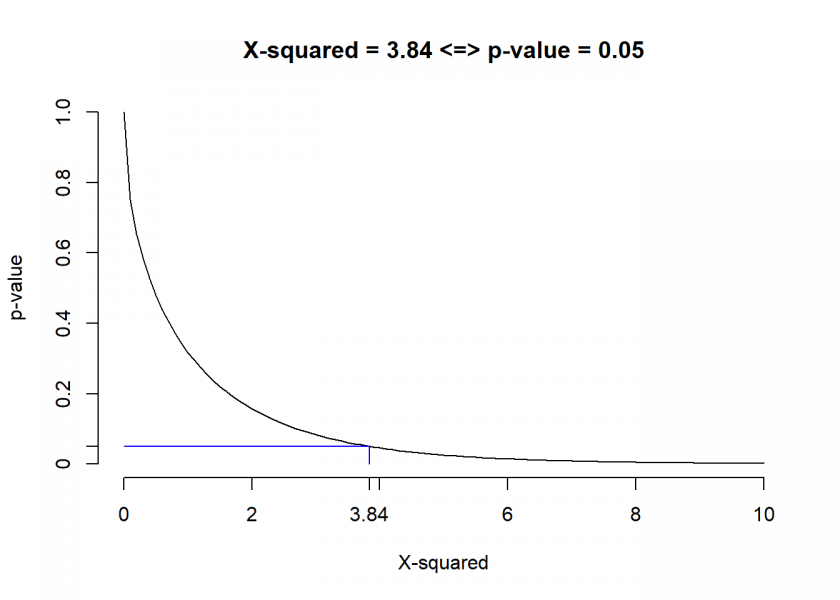
What seems like magic is actually based on solid mathematics! What we are performing here is in statistical lingo a so-called Pearson’s  (chi-squared) goodness of fit test. We won’t go into the mathematical details but it can be shown that the way the calculation is set up the test statistic follows a so-called (chi-squared) distribution. The magic number 3.84 is just the 5% mark of the p-value:
curve(pchisq(x, df = 1, lower.tail = FALSE), from = 0, to = 10, axes = FALSE, xlab = "X-squared", ylab = "p-value", main = "X-squared = 3.84 <=> p-value = 0.05")
axis(1, at = c(0, 2, 3.84, seq(4, 10, 2)), labels = c("0", "2", "3.84", "4", "6", "8", "10"))
axis(2, at = c(0, 0.05, seq(0.2, 1, 0.2)), labels = c("0", "0.05", "0.2", "0.4", "0.6", "0.8", "1.0"))
lines(c(3.84, 3.84), c(0, 0.05), col = "blue")
lines(c(0, 3.84), c(0.05, 0.05), col = "blue")
This is why we can also do the above calculation directly in R:
chisq.test(c(9, 1))
##
##  Chi-squared test for given probabilities
##
## data:  c(9, 1)
## X-squared = 6.4, df = 1, p-value = 0.01141
As expected we not only get the same result but a p-value below 0.05!
Let us do another example, this time from the above-mentioned book:
You take your child to kindergarten on the first day. Of the 21 students, there are only 6 boys. You wonder if this is unusual. Based on your knowledge of biology, you expect something closer to half boys and half girls.
The values for our formula:
- Observed number of boys = 6
- Expected number of boys = 21 / 2 = 10.5
- Observed number of girls = 15
- Expected number of girls = 21/2 = 10.5
And now for the calculation (by “hand” and afterwards again with the chisq.test function:
(((6 - 10.5)^2) / 10.5) + (((15 - 10.5)^2) / 10.5)
## [1] 3.857143

chisq.test(c(6, 15))
##
##  Chi-squared test for given probabilities
##
## data:  c(6, 15)
## X-squared = 3.8571, df = 1, p-value = 0.04953
Dr. Ruland interprets the result for us:
Since our calculated value is greater than 3.84, our observed frequencies (6 boys and 15 girls) do not fit the expected frequencies very closely. (Perhaps there is another school in town for boys only?)
Isn’t it fascinating how you can perform some serious statistical analysis with this simple tool!
At point 6. I think you meant “if the result is bigger than”
Oops, indeed! Fixed it right away, thank you for catching this error!
you are welcome! Thanks for the post, I like it.
Chi-squared works for some but not all distributions. Consider, for example, the distribution of leading digits, Benford’s Law. https://en.wikipedia.org/wiki/Benford%27s_law
Thank you, Carl.
I am not sure that this is really the case because with the “goodness of fit” test you compare given cases with a known or hypothesized distribution. I don’t think that the latter has any strong limitations but I am always eager to learn! Could you give me a source? That would be great, thank you again.
For example, I found this (and many other links) where a chi-squared goodness of fit test is being performed to ascertain whether the data conform to Benford’s law:
https://rdrr.io/cran/BenfordTests/man/chisq.benftest.html.
Good point — I probably should have been more careful when responding. I should have warned that chisqr needs to be used with care for some distributions rather than implying it won’t give an appropriate evaluation. My apologies.
Dear Carl, no problem, your feedback is always valuable and very welcome… and rest assured: in most cases, it is me who makes the mistakes or expresses things ambiguously! Thank you again and looking forward to your next contribution.